Estimated Value: $290,770 - $403,000
Studio
--
Bath
1,199
Sq Ft
$295/Sq Ft
Est. Value
About This Home
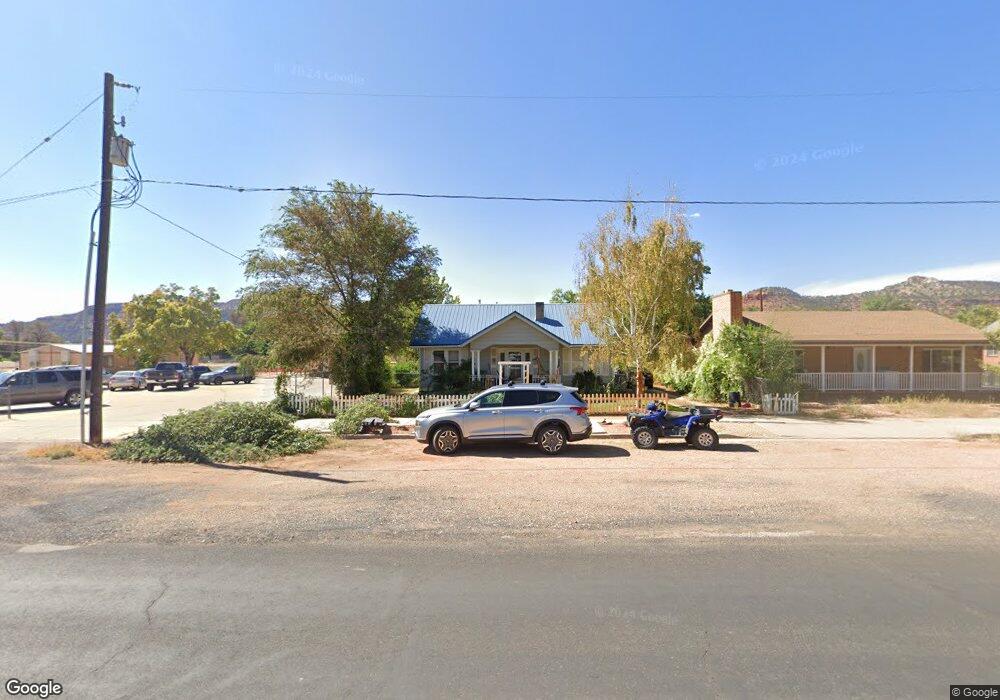
This home is located at 131 N Main St, Kanab, UT 84741 and is currently estimated at $353,943, approximately $295 per square foot. 131 N Main St is a home located in Kane County with nearby schools including Kanab Elementary School, Kanab Middle School, and Kanab High School.
Ownership History
Date
Name
Owned For
Owner Type
Purchase Details
Closed on
Jul 23, 2019
Bought by
Russell Whitaker and Rosdahl Sandalyn
Current Estimated Value
Purchase Details
Closed on
Dec 9, 2014
Sold by
Tad P Tad P and Whitaker Tad P
Bought by
Whitaker Russell K
Home Financials for this Owner
Home Financials are based on the most recent Mortgage that was taken out on this home.
Original Mortgage
$73,800
Interest Rate
4%
Mortgage Type
Purchase Money Mortgage
Purchase Details
Closed on
Dec 8, 2014
Sold by
Russell Kris Russell Kris and Whitaker Russell K
Bought by
Whitaker Russell K
Home Financials for this Owner
Home Financials are based on the most recent Mortgage that was taken out on this home.
Original Mortgage
$73,800
Interest Rate
4%
Mortgage Type
Purchase Money Mortgage
Purchase Details
Closed on
Mar 18, 2009
Sold by
Us Bank National Association
Bought by
Boyce David B
Create a Home Valuation Report for This Property
The Home Valuation Report is an in-depth analysis detailing your home's value as well as a comparison with similar homes in the area
Home Values in the Area
Average Home Value in this Area
Purchase History
| Date | Buyer | Sale Price | Title Company |
|---|---|---|---|
| Russell Whitaker | -- | -- | |
| Whitaker Russell K | -- | -- | |
| Whitaker Russell K | -- | -- | |
| Boyce David B | -- | -- |
Source: Public Records
Mortgage History
| Date | Status | Borrower | Loan Amount |
|---|---|---|---|
| Previous Owner | Whitaker Russell K | $73,800 | |
| Previous Owner | Whitaker Russell K | $73,800 |
Source: Public Records
Tax History
| Year | Tax Paid | Tax Assessment Tax Assessment Total Assessment is a certain percentage of the fair market value that is determined by local assessors to be the total taxable value of land and additions on the property. | Land | Improvement |
|---|---|---|---|---|
| 2025 | $1,213 | $257,017 | $120,452 | $136,565 |
| 2024 | $1,221 | $141,936 | $56,256 | $85,680 |
| 2023 | $1,104 | $131,467 | $53,577 | $77,890 |
| 2022 | $950 | $112,022 | $41,213 | $70,809 |
| 2021 | $865 | $153,006 | $57,640 | $95,366 |
| 2020 | $830 | $142,645 | $52,400 | $90,245 |
| 2019 | $845 | $141,340 | $49,236 | $92,104 |
| 2018 | $803 | $133,134 | $41,030 | $92,104 |
| 2017 | $764 | $121,001 | $37,300 | $83,701 |
| 2016 | $696 | $107,093 | $37,300 | $69,793 |
| 2015 | $1,169 | $100,835 | $37,300 | $63,535 |
| 2014 | $1,169 | $98,378 | $39,614 | $58,764 |
| 2013 | -- | $98,378 | $0 | $0 |
Source: Public Records
Map
Nearby Homes
Your Personal Tour Guide
Ask me questions while you tour the home.