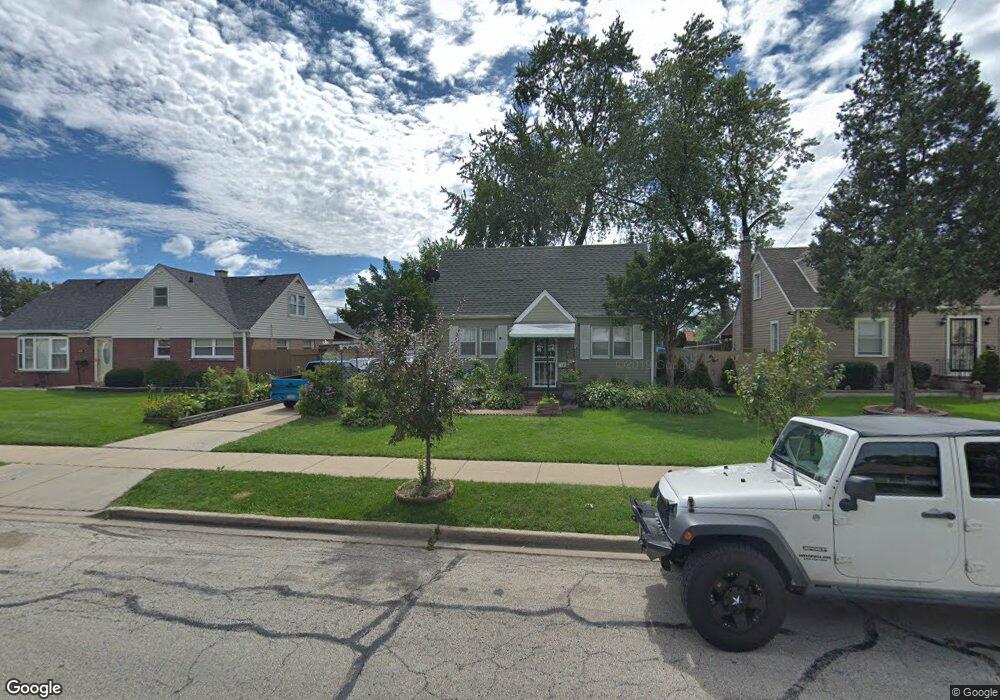
131 Parkview Dr Northlake, IL 60164
Estimated Value: $253,375 - $353,000
2
Beds
1
Bath
1,175
Sq Ft
$249/Sq Ft
Est. Value
About This Home
This home is located at 131 Parkview Dr, Northlake, IL 60164 and is currently estimated at $293,094, approximately $249 per square foot. 131 Parkview Dr is a home located in Cook County with nearby schools including Whittier Elementary School, Northlake Middle School, and West Leyden High School.
Ownership History
Date
Name
Owned For
Owner Type
Purchase Details
Closed on
Jun 25, 2004
Sold by
Lozada Adelaida
Bought by
Ramos Fernando
Current Estimated Value
Home Financials for this Owner
Home Financials are based on the most recent Mortgage that was taken out on this home.
Original Mortgage
$190,400
Outstanding Balance
$105,650
Interest Rate
7.95%
Mortgage Type
Unknown
Estimated Equity
$187,444
Purchase Details
Closed on
Jun 3, 2002
Sold by
Vega Maria E
Bought by
Lozada Adelaida and Ramos Fernando
Home Financials for this Owner
Home Financials are based on the most recent Mortgage that was taken out on this home.
Original Mortgage
$157,528
Interest Rate
6.91%
Mortgage Type
FHA
Purchase Details
Closed on
Nov 29, 2000
Sold by
Bradford Thelma L
Bought by
Vega Marie E
Home Financials for this Owner
Home Financials are based on the most recent Mortgage that was taken out on this home.
Original Mortgage
$113,900
Interest Rate
11.15%
Create a Home Valuation Report for This Property
The Home Valuation Report is an in-depth analysis detailing your home's value as well as a comparison with similar homes in the area
Home Values in the Area
Average Home Value in this Area
Purchase History
| Date | Buyer | Sale Price | Title Company |
|---|---|---|---|
| Ramos Fernando | -- | Law Title Insurance Co Inc | |
| Lozada Adelaida | $160,000 | -- | |
| Vega Marie E | $134,000 | -- |
Source: Public Records
Mortgage History
| Date | Status | Borrower | Loan Amount |
|---|---|---|---|
| Open | Ramos Fernando | $190,400 | |
| Previous Owner | Lozada Adelaida | $157,528 | |
| Previous Owner | Vega Marie E | $113,900 |
Source: Public Records
Tax History Compared to Growth
Tax History
| Year | Tax Paid | Tax Assessment Tax Assessment Total Assessment is a certain percentage of the fair market value that is determined by local assessors to be the total taxable value of land and additions on the property. | Land | Improvement |
|---|---|---|---|---|
| 2024 | $4,703 | $17,000 | $3,375 | $13,625 |
| 2023 | $5,052 | $17,000 | $3,375 | $13,625 |
| 2022 | $5,052 | $17,000 | $3,375 | $13,625 |
| 2021 | $4,839 | $14,966 | $2,625 | $12,341 |
| 2020 | $4,682 | $14,966 | $2,625 | $12,341 |
| 2019 | $4,981 | $16,892 | $2,625 | $14,267 |
| 2018 | $4,408 | $14,588 | $2,250 | $12,338 |
| 2017 | $4,447 | $14,588 | $2,250 | $12,338 |
| 2016 | $4,662 | $14,588 | $2,250 | $12,338 |
| 2015 | $4,676 | $14,179 | $2,062 | $12,117 |
| 2014 | $4,614 | $14,179 | $2,062 | $12,117 |
| 2013 | $4,333 | $14,179 | $2,062 | $12,117 |
Source: Public Records
Map
Nearby Homes
- 105 S Roy Ave
- 115 N Harold Ave
- 123 S Harold Ave
- 77 N Wolf Rd Unit 312
- 77 N Wolf Rd Unit 206
- 10 Belle Dr
- 335 N Wolf Rd
- 401 E Le Moyne Ave
- 250 Village Dr
- 411 E Le Moyne Ave
- 1601 N 44th Ave
- 1818 N 39th Ave
- 248 E Lyndale Ave
- 10445 W Palmer Ave
- 1616 N 40th Ave
- 10417 W Palmer Ave
- 1822 N 36th Ave
- 2118 Fairfield Ave
- 1530 N 39th Ave
- 1528 N 39th Ave
- 127 Parkview Dr
- 135 Parkview Dr
- 123 Parkview Dr
- 151 Parkview Dr
- 144 E North Ave
- 124 E North Ave
- 119 Parkview Dr
- 155 Parkview Dr
- 130 Parkview Dr
- 134 Parkview Dr
- 126 Parkview Dr
- 120 E North Ave
- 142 Parkview Dr Unit 3
- 117 Parkview Dr
- 159 Parkview Dr
- 116 E North Ave
- 146 Parkview Dr
- 109 Parkview Dr
- 161 Parkview Dr Unit 3
- 150 Parkview Dr