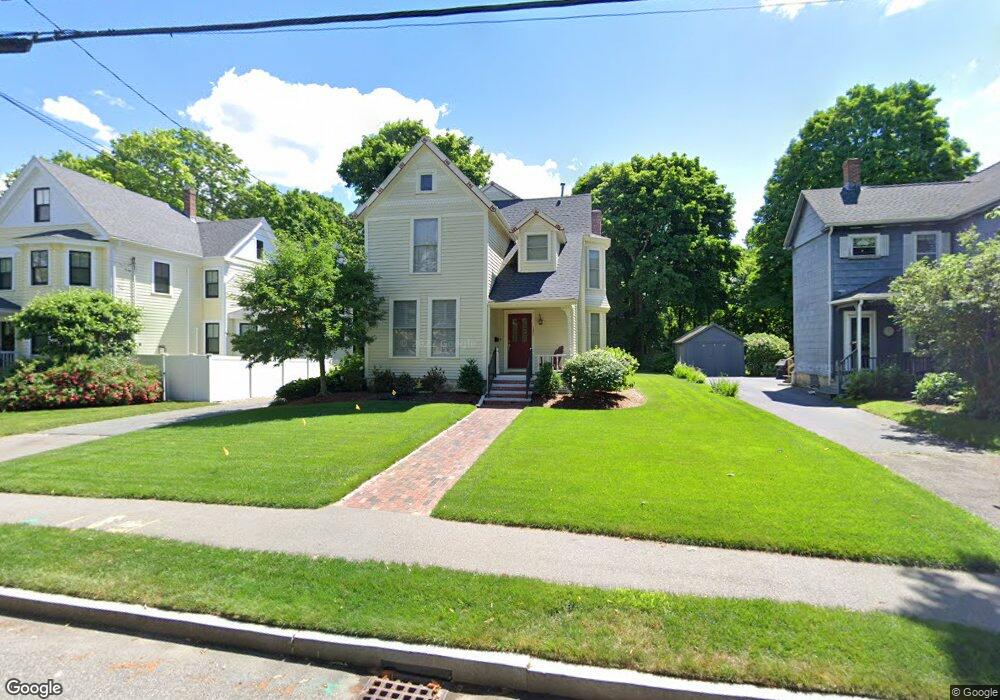
131 Pickering St Needham, MA 02492
Estimated Value: $1,888,000 - $2,204,000
4
Beds
3
Baths
1,408
Sq Ft
$1,420/Sq Ft
Est. Value
About This Home
This home is located at 131 Pickering St, Needham, MA 02492 and is currently estimated at $1,999,820, approximately $1,420 per square foot. 131 Pickering St is a home located in Norfolk County with nearby schools including High Rock Middle School, Sunita L. Williams Elementary School, and Pollard Middle School.
Ownership History
Date
Name
Owned For
Owner Type
Purchase Details
Closed on
Jun 20, 2013
Sold by
Caplan Lee R and Caplan Laurie B
Bought by
Lee R Caplan Ret and Caplan
Current Estimated Value
Purchase Details
Closed on
Jul 31, 2000
Sold by
Roberts Susan J and Roberts John J
Bought by
Caplan Lee R and Caplan Laurie B
Purchase Details
Closed on
Dec 31, 1998
Sold by
Vacca Ralph and Vacca Fiona
Bought by
Roberts Susan J and Roberts John J
Purchase Details
Closed on
Jan 28, 1998
Sold by
Corcoran Mary K
Bought by
Vacca Ralph and Vacca Fiona
Create a Home Valuation Report for This Property
The Home Valuation Report is an in-depth analysis detailing your home's value as well as a comparison with similar homes in the area
Home Values in the Area
Average Home Value in this Area
Purchase History
| Date | Buyer | Sale Price | Title Company |
|---|---|---|---|
| Lee R Caplan Ret | -- | -- | |
| Lee R Caplan Ret | -- | -- | |
| Caplan Lee R | $740,000 | -- | |
| Roberts Susan J | $630,000 | -- | |
| Vacca Ralph | $205,000 | -- | |
| Vacca Ralph | $205,000 | -- |
Source: Public Records
Mortgage History
| Date | Status | Borrower | Loan Amount |
|---|---|---|---|
| Previous Owner | Vacca Ralph | $254,600 | |
| Previous Owner | Vacca Ralph | $285,000 |
Source: Public Records
Tax History
| Year | Tax Paid | Tax Assessment Tax Assessment Total Assessment is a certain percentage of the fair market value that is determined by local assessors to be the total taxable value of land and additions on the property. | Land | Improvement |
|---|---|---|---|---|
| 2025 | $17,353 | $1,637,100 | $802,000 | $835,100 |
| 2024 | $14,975 | $1,196,100 | $582,400 | $613,700 |
| 2023 | $14,958 | $1,147,100 | $582,400 | $564,700 |
| 2022 | $14,493 | $1,084,000 | $539,400 | $544,600 |
| 2021 | $14,125 | $1,084,000 | $539,400 | $544,600 |
| 2020 | $13,208 | $1,057,500 | $539,400 | $518,100 |
| 2019 | $12,417 | $1,002,200 | $490,500 | $511,700 |
| 2018 | $11,601 | $976,500 | $490,500 | $486,000 |
| 2017 | $10,884 | $915,400 | $490,500 | $424,900 |
| 2016 | $10,617 | $920,000 | $490,500 | $429,500 |
| 2015 | $10,387 | $920,000 | $490,500 | $429,500 |
| 2014 | $9,721 | $835,100 | $426,700 | $408,400 |
Source: Public Records
Map
Nearby Homes
- 19 Highland Ct Unit 19
- 19 Oakland Ave Unit 19
- 193 Garden St
- 638 Webster St
- 638 Webster St Unit 638
- 36 Otis St Unit 36
- 233 Warren St
- 58 Morton St
- 510 Webster St
- 73 Maple St Unit 1
- 100 Bradford St
- 100 Rosemary Way Unit 129
- 24 Mellen St
- 447 Hillside Ave
- 68 Pleasant St Unit 68
- 971 Webster St
- 385 Hillside Ave
- 385 Hillside Ave Unit 385
- 190 Brookline St
- 7 West St
- 137 Pickering St
- 127 Pickering St
- 143 Pickering St
- 123 Pickering St
- 123 Pickering St Unit 2
- 123 Pickering St Unit Back
- 123 Pickering St Unit 1
- 48 Oakland Ave
- 17 Warren St
- 147 Pickering St
- 84 Kingsbury St
- 117 Pickering St
- 13 Warren St
- 21 Warren St
- 56 Oakland Ave
- 76 Kingsbury St
- 38 Oakland Ave
- 27 Warren St
- 62 Oakland Ave
- 68 Kingsbury St
Your Personal Tour Guide
Ask me questions while you tour the home.