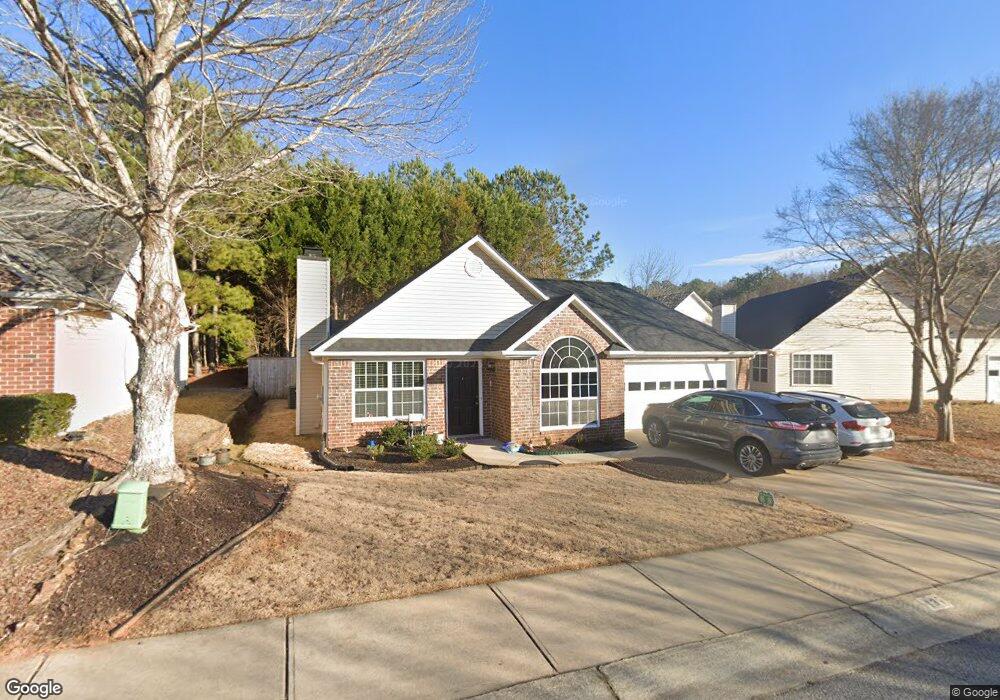
131 Pine Ridge Trace Athens, GA 30605
Estimated Value: $303,371 - $333,000
3
Beds
2
Baths
1,205
Sq Ft
$264/Sq Ft
Est. Value
About This Home
This home is located at 131 Pine Ridge Trace, Athens, GA 30605 and is currently estimated at $318,093, approximately $263 per square foot. 131 Pine Ridge Trace is a home located in Clarke County with nearby schools including Barnett Shoals Elementary School, Hilsman Middle School, and Cedar Shoals High School.
Ownership History
Date
Name
Owned For
Owner Type
Purchase Details
Closed on
Aug 28, 2023
Sold by
Torrey Alexander
Bought by
Torrey Hilda P and Torrey Richard
Current Estimated Value
Home Financials for this Owner
Home Financials are based on the most recent Mortgage that was taken out on this home.
Original Mortgage
$199,500
Outstanding Balance
$174,509
Interest Rate
6.9%
Mortgage Type
New Conventional
Estimated Equity
$143,584
Purchase Details
Closed on
Apr 11, 2005
Sold by
Live Oak Communities Llc
Bought by
Torrey Richard and Torrey Hilda P
Home Financials for this Owner
Home Financials are based on the most recent Mortgage that was taken out on this home.
Original Mortgage
$111,200
Interest Rate
5.63%
Mortgage Type
New Conventional
Purchase Details
Closed on
Apr 21, 2004
Sold by
Pinecrest Community Llc
Bought by
Live Oak Communitites Llc
Create a Home Valuation Report for This Property
The Home Valuation Report is an in-depth analysis detailing your home's value as well as a comparison with similar homes in the area
Purchase History
| Date | Buyer | Sale Price | Title Company |
|---|---|---|---|
| Torrey Hilda P | -- | -- | |
| Torrey Richard | $139,000 | -- | |
| Live Oak Communities Llc | -- | -- | |
| Live Oak Communitites Llc | -- | -- |
Source: Public Records
Mortgage History
| Date | Status | Borrower | Loan Amount |
|---|---|---|---|
| Open | Torrey Hilda P | $199,500 | |
| Previous Owner | Live Oak Communities Llc | $111,200 |
Source: Public Records
Tax History
| Year | Tax Paid | Tax Assessment Tax Assessment Total Assessment is a certain percentage of the fair market value that is determined by local assessors to be the total taxable value of land and additions on the property. | Land | Improvement |
|---|---|---|---|---|
| 2025 | $1,997 | $119,503 | $12,000 | $107,503 |
| 2024 | $1,997 | $109,696 | $12,000 | $97,696 |
| 2023 | $814 | $102,722 | $12,000 | $90,722 |
| 2022 | $1,981 | $87,996 | $10,400 | $77,596 |
| 2021 | $1,904 | $74,444 | $10,400 | $64,044 |
| 2020 | $1,833 | $69,270 | $10,400 | $58,870 |
| 2019 | $2,072 | $61,034 | $10,400 | $50,634 |
| 2018 | $2,025 | $59,661 | $10,400 | $49,261 |
| 2017 | $1,934 | $56,972 | $10,400 | $46,572 |
| 2016 | $1,715 | $50,514 | $10,400 | $40,114 |
| 2015 | $1,706 | $50,179 | $10,400 | $39,779 |
| 2014 | $1,571 | $46,148 | $10,400 | $35,748 |
Source: Public Records
Map
Nearby Homes
- 119 Pine Ridge Trace
- 325 Segrest Cir
- 375 Segrest Cir
- 140 Whitehall Rd
- 365 Whitehall Rd
- 369 Whitehall Rd
- 400 Ansley Dr
- 223 Oconee River Cir
- 145 Phinizy Ln
- 1055 College Station Rd
- 110 Vista Dr
- 431 College Cir
- 148 Warren Way
- 411 College Cir
- 150 Rumson Rd
- 360 Ansley Dr
- 380 Ansley Dr
- 370 Ansley Dr
- 585 White Cir Unit 509
- 585 White Cir Unit 17
- 125 Pine Ridge Trace
- 137 Pine Ridge Trace
- 200 Cedar Rock Trace
- 105 Pine Bark Ln
- 196 Cedar Rock Trace
- 142 Pine Ridge Trace
- 100 Pine Bark Ln
- 148 Pine Ridge Trace
- 148 Pine Ridge Trace Unit TR
- 115 Pine Bark Ln
- 192 Cedar Rock Trace
- 113 Pine Ridge Trace
- 143 Pine Ridge Trace
- 124 Pine Ridge Trace
- 205 Cedar Rock Trace
- 154 Pine Ridge Trace
- 188 Cedar Rock Trace
- 107 Pine Ridge Trace
- 120 Pine Bark Ln
Your Personal Tour Guide
Ask me questions while you tour the home.