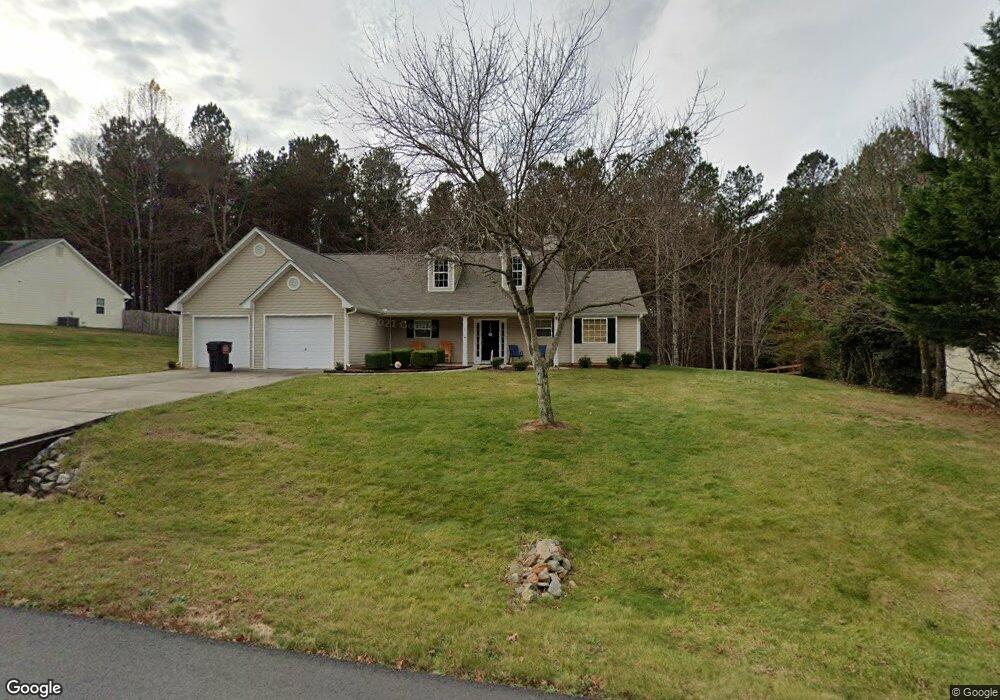
131 Pine Tree Dr Dawsonville, GA 30534
Estimated Value: $337,111 - $379,000
Studio
2
Baths
1,784
Sq Ft
$204/Sq Ft
Est. Value
About This Home
This home is located at 131 Pine Tree Dr, Dawsonville, GA 30534 and is currently estimated at $364,278, approximately $204 per square foot. 131 Pine Tree Dr is a home located in Lumpkin County with nearby schools including Lumpkin County Middle School, Lumpkin County High School, and Bay Creek Christian Academy.
Ownership History
Date
Name
Owned For
Owner Type
Purchase Details
Closed on
Sep 2, 2005
Sold by
Cameron Palmer Homes Inc
Bought by
Glidden George H and Glidden Barbara A
Current Estimated Value
Purchase Details
Closed on
Jan 6, 2005
Sold by
C & Y Home Builders Inc
Bought by
Cameron Plamer Homes Inc
Home Financials for this Owner
Home Financials are based on the most recent Mortgage that was taken out on this home.
Original Mortgage
$106,425
Interest Rate
5.61%
Mortgage Type
New Conventional
Purchase Details
Closed on
Dec 3, 2004
Sold by
Patrick Development Llc
Bought by
C & Y Home Builders Inc
Home Financials for this Owner
Home Financials are based on the most recent Mortgage that was taken out on this home.
Original Mortgage
$106,425
Interest Rate
5.61%
Mortgage Type
New Conventional
Create a Home Valuation Report for This Property
The Home Valuation Report is an in-depth analysis detailing your home's value as well as a comparison with similar homes in the area
Home Values in the Area
Average Home Value in this Area
Purchase History
We collect this data history from publicly available records. To have your information removed, we recommend requesting removal directly through your county’s website.
| Date | Buyer | Sale Price | Title Company |
|---|---|---|---|
| Glidden George H | $132,500 | -- | |
| Cameron Plamer Homes Inc | $157,500 | -- | |
| C & Y Home Builders Inc | $1,966,500 | -- |
Source: Public Records
Mortgage History
We collect this data history from publicly available records. To have your information removed, we recommend requesting removal directly through your county’s website.
| Date | Status | Borrower | Loan Amount |
|---|---|---|---|
| Previous Owner | Cameron Plamer Homes Inc | $106,425 |
Source: Public Records
Tax History
| Year | Tax Paid | Tax Assessment Tax Assessment Total Assessment is a certain percentage of the fair market value that is determined by local assessors to be the total taxable value of land and additions on the property. | Land | Improvement |
|---|---|---|---|---|
| 2025 | $493 | $130,506 | $12,000 | $118,506 |
| 2024 | $207 | $122,037 | $12,000 | $110,037 |
| 2023 | $225 | $110,337 | $8,000 | $102,337 |
| 2022 | $302 | $98,076 | $8,000 | $90,076 |
| 2021 | $143 | $82,273 | $8,000 | $74,273 |
| 2020 | $123 | $80,078 | $8,000 | $72,078 |
| 2019 | $127 | $80,078 | $8,000 | $72,078 |
| 2018 | $39 | $71,405 | $8,000 | $63,405 |
| 2017 | $0 | $66,647 | $8,000 | $58,647 |
| 2016 | -- | $52,709 | $6,000 | $46,709 |
| 2015 | -- | $52,709 | $6,000 | $46,709 |
| 2014 | -- | $53,222 | $6,000 | $47,222 |
| 2013 | -- | $53,735 | $6,000 | $47,735 |
Source: Public Records
Map
Nearby Homes
- 148 Pine Tree Ct
- 320 Fern Park Dr
- 1249 Little Mountain Rd
- 1247 Little Mountain Rd
- 131 Makers Way
- 544 Makers Way
- 0 Lee Mashburn Rd Unit 10704046
- 00 Lee Mashburn Rd
- 0 Lee Mashburn Rd Unit 26513582
- 6418 Dawsonville Hwy
- 40 Patriot Trail
- 0 Rider Rd Unit 7481902
- 0 Rider Rd Unit 10408283
- 1107 Larmon Forks Rd
- 40 Patriot View Dr
- 499 Rider Rd
- 475 Larmon Forks Rd
- 555 Larmon Forks Rd
- 116 Lakota Dr
- 285 Grand Oak Ln
- 153 Pine Tree Dr
- 107 Pine Tree Dr
- 142 Pine Tree Dr
- 173 Pine Tree Dr
- 112 Pine Tree Dr
- 79 Pine Tree Dr
- 183 Pine Tree Dr Unit 9
- 183 Pine Tree Dr
- 19 Oak Ridge Dr
- 52 Pine Tree Ct
- 81 Pine Tree Dr
- 49 Pine Tree Dr
- 193 Pine Tree Dr Unit 10
- 193 Pine Tree Dr
- 28 Oak Ridge
- 16 Oak Ridge Dr
- 228 Pine Tree Dr Unit LOT 40
- 228 Pine Tree Dr
- 27 Pine Tree Dr
- 66 Pine Tree Ct
Your Personal Tour Guide
Ask me questions while you tour the home.