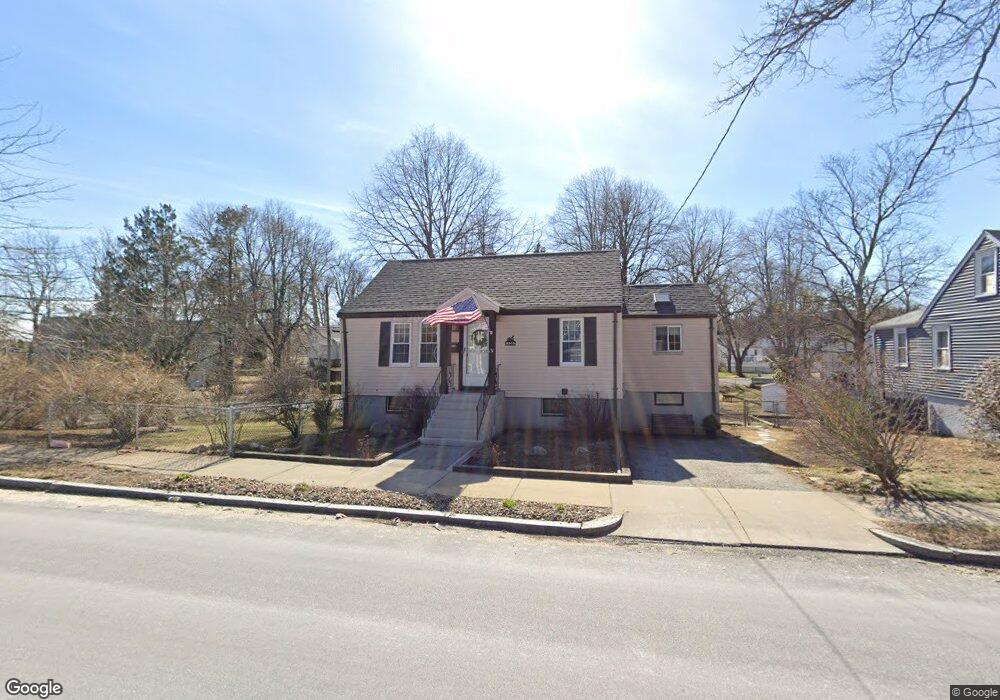
131 Pond St Stoneham, MA 02180
Haywardville NeighborhoodEstimated Value: $616,000 - $679,000
3
Beds
1
Bath
1,419
Sq Ft
$461/Sq Ft
Est. Value
About This Home
This home is located at 131 Pond St, Stoneham, MA 02180 and is currently estimated at $653,630, approximately $460 per square foot. 131 Pond St is a home located in Middlesex County with nearby schools including Stoneham High School, Greater Boston Academy, and St. Patrick Elementary School.
Ownership History
Date
Name
Owned For
Owner Type
Purchase Details
Closed on
Oct 13, 1987
Sold by
Marcolonyo Julia M
Bought by
Ruglia Christopher M
Current Estimated Value
Home Financials for this Owner
Home Financials are based on the most recent Mortgage that was taken out on this home.
Original Mortgage
$135,000
Interest Rate
10.33%
Mortgage Type
Purchase Money Mortgage
Create a Home Valuation Report for This Property
The Home Valuation Report is an in-depth analysis detailing your home's value as well as a comparison with similar homes in the area
Home Values in the Area
Average Home Value in this Area
Purchase History
| Date | Buyer | Sale Price | Title Company |
|---|---|---|---|
| Ruglia Christopher M | $151,000 | -- |
Source: Public Records
Mortgage History
| Date | Status | Borrower | Loan Amount |
|---|---|---|---|
| Open | Ruglia Christopher M | $175,000 | |
| Closed | Ruglia Christopher M | $27,000 | |
| Closed | Ruglia Christopher M | $135,000 |
Source: Public Records
Tax History Compared to Growth
Tax History
| Year | Tax Paid | Tax Assessment Tax Assessment Total Assessment is a certain percentage of the fair market value that is determined by local assessors to be the total taxable value of land and additions on the property. | Land | Improvement |
|---|---|---|---|---|
| 2025 | $5,613 | $548,700 | $368,600 | $180,100 |
| 2024 | $5,440 | $513,700 | $339,500 | $174,200 |
| 2023 | $5,297 | $477,200 | $310,400 | $166,800 |
| 2022 | $4,571 | $439,100 | $281,300 | $157,800 |
| 2021 | $6,654 | $392,600 | $242,500 | $150,100 |
| 2020 | $4,151 | $384,700 | $231,400 | $153,300 |
| 2019 | $4,243 | $378,200 | $214,700 | $163,500 |
| 2018 | $4,189 | $357,700 | $212,100 | $145,600 |
| 2017 | $3,658 | $295,200 | $190,400 | $104,800 |
| 2016 | $3,623 | $285,300 | $190,400 | $94,900 |
| 2015 | $3,340 | $257,700 | $171,400 | $86,300 |
| 2014 | $3,038 | $225,200 | $152,300 | $72,900 |
Source: Public Records
Map
Nearby Homes
- 588 Main St Unit 3C
- 25 Murdoch Rd
- 5 Rockville Park
- 5-9 Rockville Park
- 222 Park St
- 8 Walnut St
- 5 Sheffield Rd
- 34 Warren St Unit 3
- 137 Franklin St Unit 102
- 137 Franklin St Unit 404
- 159 Franklin St Unit C2
- 17 Franklin St
- 220 Fellsview Terrace Unit 223
- 349 W Emerson St
- 200 Park Terrace Dr Unit 226
- 17 Emerson St Unit A
- 17A 17 B Emerson
- 300 Park Terrace Dr Unit 354
- 14 Dinanno Rd
- 39 Tamarock Terrace