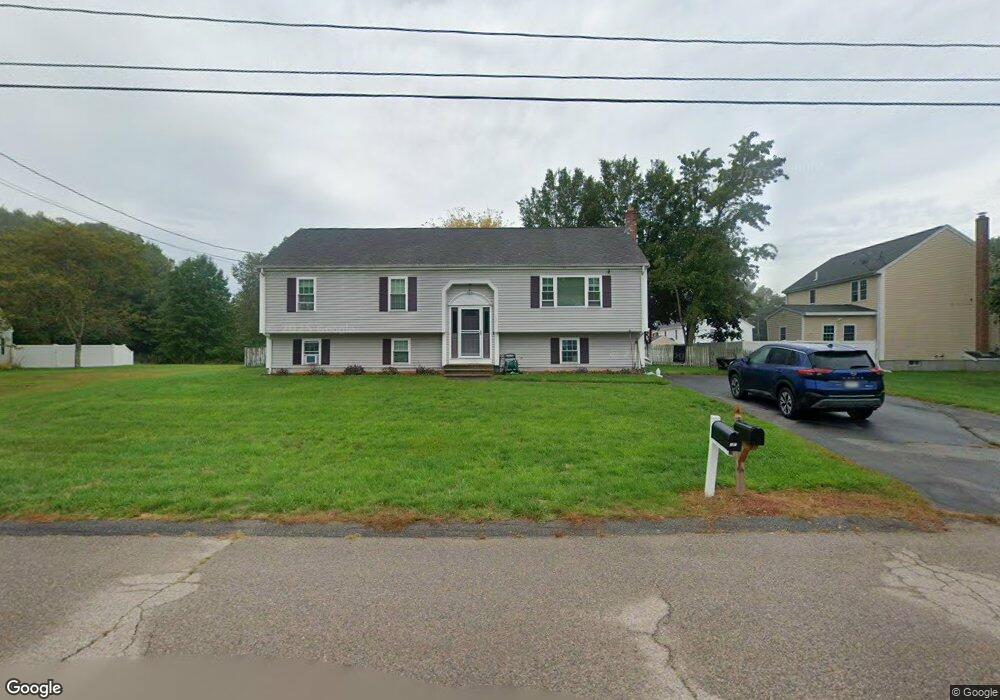
131 Quequechan Rd Taunton, MA 02780
Estimated Value: $533,424 - $601,000
3
Beds
2
Baths
1,701
Sq Ft
$339/Sq Ft
Est. Value
About This Home
This home is located at 131 Quequechan Rd, Taunton, MA 02780 and is currently estimated at $576,356, approximately $338 per square foot. 131 Quequechan Rd is a home located in Bristol County with nearby schools including Edmund Hatch Bennett School, Benjamin Friedman Middle School, and Taunton High School.
Ownership History
Date
Name
Owned For
Owner Type
Purchase Details
Closed on
Jun 18, 2024
Sold by
Chagaruly John P and Chagaruly Linda J
Bought by
Chagaruly John P and Chagaruly Linda J
Current Estimated Value
Purchase Details
Closed on
Apr 30, 1999
Sold by
Malloch Const Co Inc
Bought by
Chagaruly John P and Chagaruly Linda J
Home Financials for this Owner
Home Financials are based on the most recent Mortgage that was taken out on this home.
Original Mortgage
$136,912
Interest Rate
6.95%
Mortgage Type
Purchase Money Mortgage
Purchase Details
Closed on
Dec 21, 1998
Sold by
Bruce Dev Corp
Bought by
Malloch Constr Co Inc
Create a Home Valuation Report for This Property
The Home Valuation Report is an in-depth analysis detailing your home's value as well as a comparison with similar homes in the area
Home Values in the Area
Average Home Value in this Area
Purchase History
| Date | Buyer | Sale Price | Title Company |
|---|---|---|---|
| Chagaruly John P | -- | None Available | |
| Chagaruly John P | -- | None Available | |
| Chagaruly John P | $158,652 | -- | |
| Malloch Constr Co Inc | $40,000 | -- | |
| Chagaruly John P | $158,652 | -- | |
| Malloch Constr Co Inc | $40,000 | -- |
Source: Public Records
Mortgage History
| Date | Status | Borrower | Loan Amount |
|---|---|---|---|
| Previous Owner | Malloch Constr Co Inc | $175,200 | |
| Previous Owner | Malloch Constr Co Inc | $168,712 | |
| Previous Owner | Malloch Constr Co Inc | $136,912 |
Source: Public Records
Tax History Compared to Growth
Tax History
| Year | Tax Paid | Tax Assessment Tax Assessment Total Assessment is a certain percentage of the fair market value that is determined by local assessors to be the total taxable value of land and additions on the property. | Land | Improvement |
|---|---|---|---|---|
| 2025 | $4,980 | $455,200 | $130,800 | $324,400 |
| 2024 | $4,548 | $406,400 | $130,800 | $275,600 |
| 2023 | $4,679 | $388,300 | $136,800 | $251,500 |
| 2022 | $4,402 | $334,000 | $106,100 | $227,900 |
| 2021 | $4,144 | $291,800 | $96,400 | $195,400 |
| 2020 | $4,040 | $271,900 | $96,400 | $175,500 |
| 2019 | $4,208 | $267,000 | $96,400 | $170,600 |
| 2018 | $4,018 | $255,600 | $97,400 | $158,200 |
| 2017 | $3,759 | $239,300 | $92,300 | $147,000 |
| 2016 | $3,652 | $232,900 | $89,600 | $143,300 |
| 2015 | $3,415 | $227,500 | $87,200 | $140,300 |
| 2014 | $3,297 | $225,700 | $87,200 | $138,500 |
Source: Public Records
Map
Nearby Homes
- 45 Fisher St
- 64 Kalman Place
- 321 Winthrop St Unit 109
- 6 Grove Ave
- 92 Highland Ave
- 170 Highland St Unit 320
- 170 Highland St Unit 119
- 173 Highland St Unit 201
- 1181 Cohannet St
- 140 N Walker St Unit 511
- 15 Chase St
- 193 Winthrop St
- 410 Warner Blvd Unit A
- 26 Kilmer Ave
- 125 Highland St Unit 103
- 75 Wales St
- 137 Tremont St
- LOT A Dwinell Rd
- 15 Shetland Rd
- 424 Winthrop St
- 43 Mcintosh Dr
- 43 Mcintosh Dr
- 33 Mcintosh Dr
- 147 Quequechan Rd
- 130 Quequechan Rd
- 38 Mcintosh Dr
- 59 Mcintosh Dr
- 37 Mcintosh Dr
- 15 Mcintosh Dr
- 140 Quequechan Rd
- 150 Quequechan Rd
- 32 Mcintosh Dr
- 58 Mcintosh Dr
- 101 Quequechan Rd
- 5 Mcintosh Dr
- 77 Mcintosh Dr
- 18 Mcintosh Dr
- 6 Mcintosh Dr
- 100 Quequechan Rd
- 0 Quequechan Rd