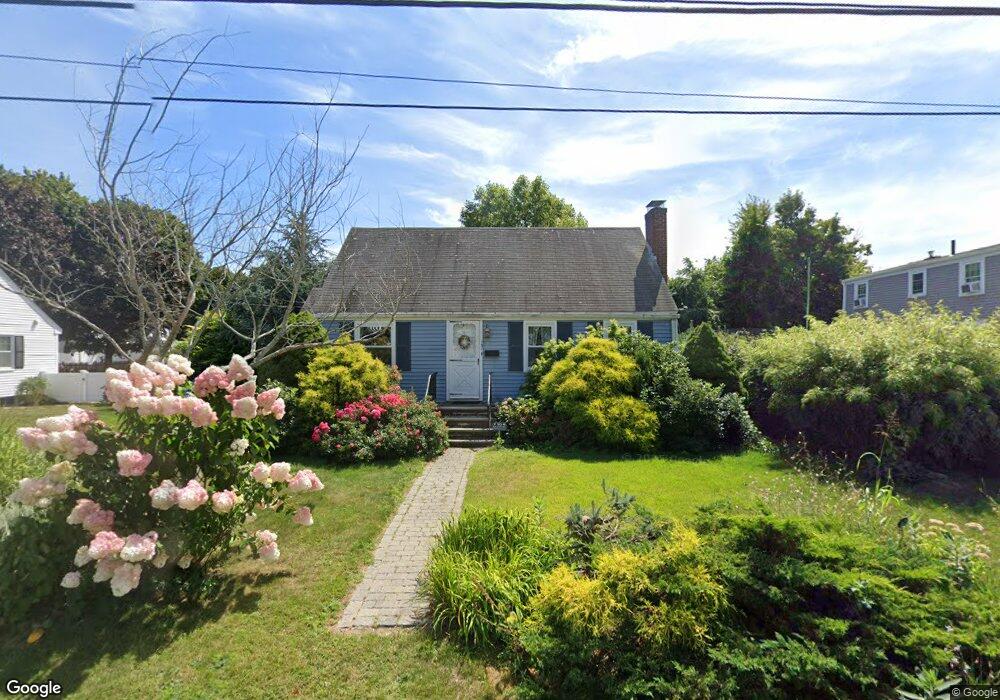
131 Rinaldo Rd North Weymouth, MA 02191
North Weymouth NeighborhoodEstimated Value: $544,000 - $618,000
3
Beds
2
Baths
1,152
Sq Ft
$503/Sq Ft
Est. Value
About This Home
This home is located at 131 Rinaldo Rd, North Weymouth, MA 02191 and is currently estimated at $579,832, approximately $503 per square foot. 131 Rinaldo Rd is a home located in Norfolk County with nearby schools including Abigail Adams Middle School, Wessagusset Elementary School, and Weymouth Middle School Chapman.
Ownership History
Date
Name
Owned For
Owner Type
Purchase Details
Closed on
Jul 23, 2019
Sold by
Packard David and Miller Jessica
Bought by
Miller Jessica
Current Estimated Value
Purchase Details
Closed on
Jun 24, 2010
Sold by
Nealon Irt
Bought by
Packard David and Miller Jessica
Home Financials for this Owner
Home Financials are based on the most recent Mortgage that was taken out on this home.
Original Mortgage
$195,000
Interest Rate
4.98%
Mortgage Type
Purchase Money Mortgage
Create a Home Valuation Report for This Property
The Home Valuation Report is an in-depth analysis detailing your home's value as well as a comparison with similar homes in the area
Home Values in the Area
Average Home Value in this Area
Purchase History
| Date | Buyer | Sale Price | Title Company |
|---|---|---|---|
| Miller Jessica | -- | -- | |
| Packard David | $295,000 | -- |
Source: Public Records
Mortgage History
| Date | Status | Borrower | Loan Amount |
|---|---|---|---|
| Previous Owner | Packard David | $195,000 |
Source: Public Records
Tax History
| Year | Tax Paid | Tax Assessment Tax Assessment Total Assessment is a certain percentage of the fair market value that is determined by local assessors to be the total taxable value of land and additions on the property. | Land | Improvement |
|---|---|---|---|---|
| 2025 | $4,866 | $481,800 | $219,000 | $262,800 |
| 2024 | $4,717 | $459,300 | $208,600 | $250,700 |
| 2023 | $4,546 | $435,000 | $193,200 | $241,800 |
| 2022 | $4,451 | $388,400 | $178,900 | $209,500 |
| 2021 | $4,159 | $354,300 | $178,900 | $175,400 |
| 2020 | $3,999 | $335,500 | $178,900 | $156,600 |
| 2019 | $3,905 | $322,200 | $172,000 | $150,200 |
| 2018 | $3,850 | $308,000 | $163,800 | $144,200 |
| 2017 | $3,671 | $286,600 | $148,900 | $137,700 |
| 2016 | $3,530 | $275,800 | $143,200 | $132,600 |
| 2015 | $3,372 | $261,400 | $136,400 | $125,000 |
| 2014 | $3,179 | $239,000 | $126,900 | $112,100 |
Source: Public Records
Map
Nearby Homes
- 10 Marion Rd
- 70 Holmes Ave
- 92 Doris Dr
- 109 Merryknoll Rd
- 70 Colonial Rd
- 237 North St Unit A
- 30 Puritan Rd
- 90 Sea St Unit 204
- 5 Endicott St
- 425 East St
- 148 Chard St
- 70 Biscayne Ave
- 78 Middle St
- 47 Academy Ave
- 9 Davids Island Rd
- 49 Cornish St
- 10 Hobamack Rd
- 1206 Tuckers Ln Unit 1206
- 29-31 Broad Street Place
- 211 Roosevelt Rd
Your Personal Tour Guide
Ask me questions while you tour the home.