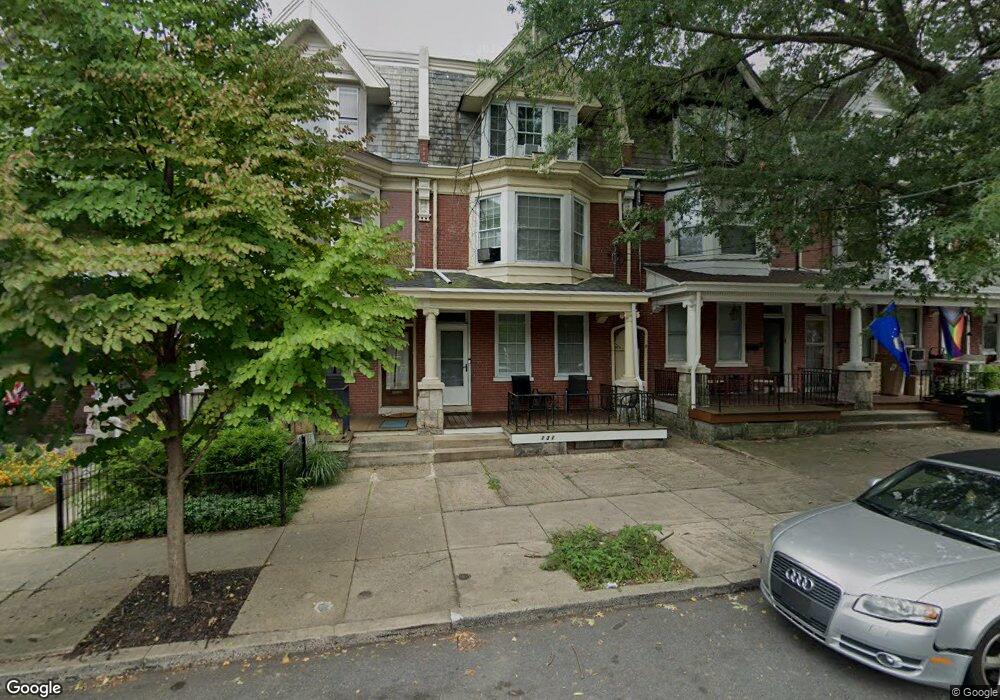
131 Ruby St Lancaster, PA 17603
West End NeighborhoodEstimated Value: $223,559 - $282,000
5
Beds
1
Bath
2,012
Sq Ft
$128/Sq Ft
Est. Value
About This Home
This home is located at 131 Ruby St, Lancaster, PA 17603 and is currently estimated at $256,640, approximately $127 per square foot. 131 Ruby St is a home located in Lancaster County with nearby schools including Smith-Wade-El Elementary School, Wheatland Middle School, and McCaskey High School.
Ownership History
Date
Name
Owned For
Owner Type
Purchase Details
Closed on
Aug 6, 2010
Sold by
Bitts Carole A
Bought by
Ndoci Mark N
Current Estimated Value
Home Financials for this Owner
Home Financials are based on the most recent Mortgage that was taken out on this home.
Original Mortgage
$65,000
Outstanding Balance
$43,382
Interest Rate
4.73%
Mortgage Type
Seller Take Back
Estimated Equity
$213,258
Create a Home Valuation Report for This Property
The Home Valuation Report is an in-depth analysis detailing your home's value as well as a comparison with similar homes in the area
Home Values in the Area
Average Home Value in this Area
Purchase History
| Date | Buyer | Sale Price | Title Company |
|---|---|---|---|
| Ndoci Mark N | $74,000 | None Available |
Source: Public Records
Mortgage History
| Date | Status | Borrower | Loan Amount |
|---|---|---|---|
| Open | Ndoci Mark N | $65,000 |
Source: Public Records
Tax History
| Year | Tax Paid | Tax Assessment Tax Assessment Total Assessment is a certain percentage of the fair market value that is determined by local assessors to be the total taxable value of land and additions on the property. | Land | Improvement |
|---|---|---|---|---|
| 2025 | $3,399 | $85,000 | $23,300 | $61,700 |
| 2024 | $3,363 | $85,000 | $23,300 | $61,700 |
| 2023 | $3,307 | $85,000 | $23,300 | $61,700 |
| 2022 | $3,169 | $85,000 | $23,300 | $61,700 |
| 2021 | $3,101 | $85,000 | $23,300 | $61,700 |
| 2020 | $3,101 | $85,000 | $23,300 | $61,700 |
| 2019 | $3,055 | $85,000 | $23,300 | $61,700 |
| 2018 | $1,813 | $85,000 | $23,300 | $61,700 |
| 2017 | $3,472 | $75,600 | $16,200 | $59,400 |
| 2016 | $3,441 | $75,600 | $16,200 | $59,400 |
| 2015 | $1,342 | $75,600 | $16,200 | $59,400 |
| 2014 | $3,003 | $75,600 | $16,200 | $59,400 |
Source: Public Records
Map
Nearby Homes
Your Personal Tour Guide
Ask me questions while you tour the home.