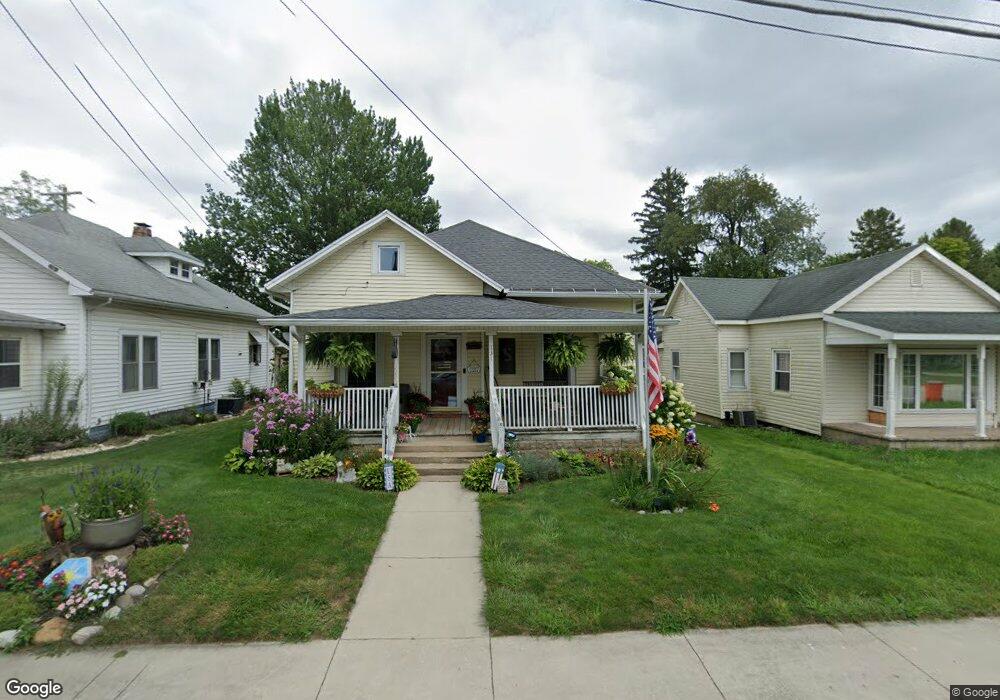
131 S Elm St Bunker Hill, IN 46914
Estimated Value: $133,000 - $179,874
2
Beds
1
Bath
1,542
Sq Ft
$100/Sq Ft
Est. Value
About This Home
This home is located at 131 S Elm St, Bunker Hill, IN 46914 and is currently estimated at $153,969, approximately $99 per square foot. 131 S Elm St is a home located in Miami County with nearby schools including Pipe Creek Elementary School, Maconaquah Elementary School, and Maconaquah Middle School.
Ownership History
Date
Name
Owned For
Owner Type
Purchase Details
Closed on
May 30, 2013
Sold by
Scott Eugene
Bought by
Scott Eugene and Scott Tara A
Current Estimated Value
Home Financials for this Owner
Home Financials are based on the most recent Mortgage that was taken out on this home.
Original Mortgage
$43,800
Outstanding Balance
$9,773
Interest Rate
3.38%
Mortgage Type
New Conventional
Estimated Equity
$144,196
Purchase Details
Closed on
Nov 22, 2006
Sold by
Scott Mellisa M
Bought by
Scott Eugene
Home Financials for this Owner
Home Financials are based on the most recent Mortgage that was taken out on this home.
Original Mortgage
$45,600
Interest Rate
6.4%
Mortgage Type
New Conventional
Create a Home Valuation Report for This Property
The Home Valuation Report is an in-depth analysis detailing your home's value as well as a comparison with similar homes in the area
Home Values in the Area
Average Home Value in this Area
Purchase History
| Date | Buyer | Sale Price | Title Company |
|---|---|---|---|
| Scott Eugene | -- | None Available | |
| Scott Eugene | -- | None Available |
Source: Public Records
Mortgage History
| Date | Status | Borrower | Loan Amount |
|---|---|---|---|
| Open | Scott Eugene | $43,800 | |
| Closed | Scott Eugene | $45,600 |
Source: Public Records
Tax History Compared to Growth
Tax History
| Year | Tax Paid | Tax Assessment Tax Assessment Total Assessment is a certain percentage of the fair market value that is determined by local assessors to be the total taxable value of land and additions on the property. | Land | Improvement |
|---|---|---|---|---|
| 2024 | $1,295 | $129,500 | $6,600 | $122,900 |
| 2023 | $1,295 | $131,600 | $6,600 | $125,000 |
| 2022 | $1,298 | $132,100 | $6,600 | $125,500 |
| 2021 | $660 | $86,000 | $6,600 | $79,400 |
| 2020 | $942 | $86,200 | $6,600 | $79,600 |
| 2019 | $930 | $86,200 | $6,600 | $79,600 |
| 2018 | $851 | $73,900 | $6,600 | $67,300 |
| 2017 | $824 | $71,900 | $6,500 | $65,400 |
| 2016 | $227 | $50,400 | $6,500 | $43,900 |
| 2014 | $128 | $49,900 | $6,500 | $43,400 |
| 2013 | -- | $48,600 | $6,500 | $42,100 |
Source: Public Records
Map
Nearby Homes
- 2361 W Broadway
- Elm Street S 1100 St S
- 6559 S Abbi Ct
- 1758 N Lancer St
- 9934 S 150 W
- 4608 S 100 W
- 2031 Shaw Ave
- 2082 W 1050 S
- 3001 March St
- 3210 Schilling St
- 4189 U S 31
- 1352 W 400 S
- 39033 Edwards Ct
- 2042 W 400 S
- 2940 W 400 S
- 4364 W 500 S
- 3047 S Wallick Rd
- Lot 15 W Barberry Ln
- Lot 14 W Barberry Ln Unit 14
- 2893 S Us Route 31