Estimated Value: $374,000 - $414,000
4
Beds
3
Baths
3,078
Sq Ft
$127/Sq Ft
Est. Value
About This Home
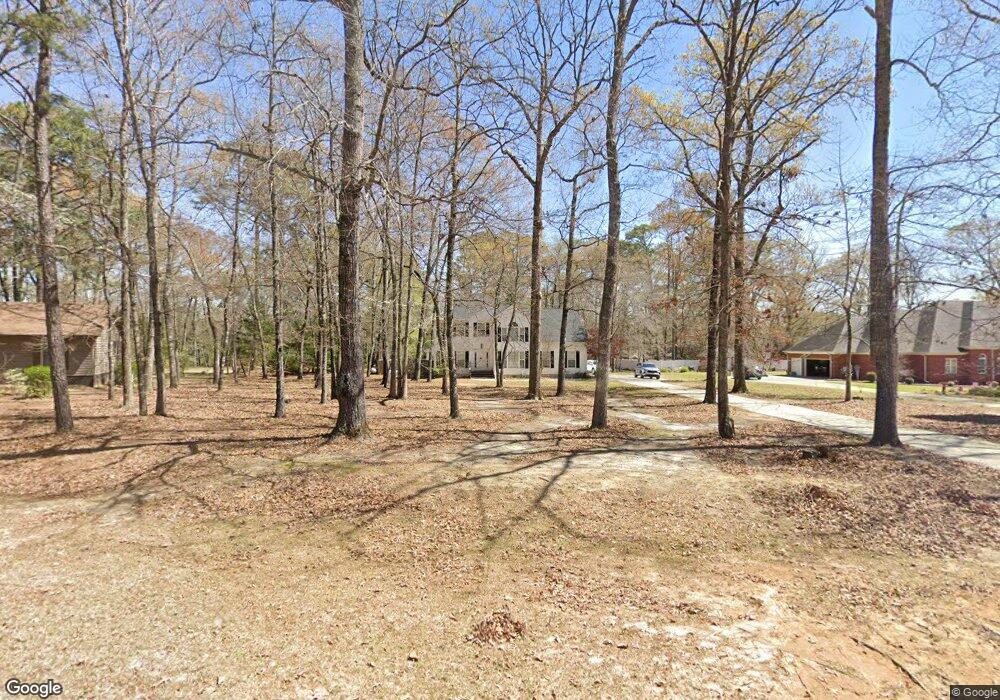
This home is located at 131 S Live Oak Ct, Byron, GA 31008 and is currently estimated at $392,428, approximately $127 per square foot. 131 S Live Oak Ct is a home located in Peach County with nearby schools including Byron Elementary School, Byron Middle School, and Peach County High School.
Ownership History
Date
Name
Owned For
Owner Type
Purchase Details
Closed on
Jul 26, 2006
Sold by
Federal Home Loan Mortgage Corporation
Bought by
Cartwright Samuel and Cartwright Jacquelyn T
Current Estimated Value
Home Financials for this Owner
Home Financials are based on the most recent Mortgage that was taken out on this home.
Original Mortgage
$239,031
Outstanding Balance
$143,355
Interest Rate
6.74%
Mortgage Type
VA
Estimated Equity
$249,074
Purchase Details
Closed on
Jan 3, 2006
Sold by
Wells Fargo Bank
Bought by
Federal Home Loan Mortgage Corporation
Purchase Details
Closed on
May 17, 2001
Sold by
Huckabee William H
Bought by
White David
Purchase Details
Closed on
Dec 20, 1999
Sold by
Greiling Farms Inc
Bought by
Huckabee William H
Purchase Details
Closed on
Jun 16, 1981
Bought by
Greiling Farms Inc
Create a Home Valuation Report for This Property
The Home Valuation Report is an in-depth analysis detailing your home's value as well as a comparison with similar homes in the area
Home Values in the Area
Average Home Value in this Area
Purchase History
| Date | Buyer | Sale Price | Title Company |
|---|---|---|---|
| Cartwright Samuel | $234,000 | -- | |
| Federal Home Loan Mortgage Corporation | -- | -- | |
| Wells Fargo Bank | -- | -- | |
| White David | $17,500 | -- | |
| Huckabee William H | $14,500 | -- | |
| Greiling Farms Inc | -- | -- |
Source: Public Records
Mortgage History
| Date | Status | Borrower | Loan Amount |
|---|---|---|---|
| Open | Cartwright Samuel | $239,031 |
Source: Public Records
Tax History Compared to Growth
Tax History
| Year | Tax Paid | Tax Assessment Tax Assessment Total Assessment is a certain percentage of the fair market value that is determined by local assessors to be the total taxable value of land and additions on the property. | Land | Improvement |
|---|---|---|---|---|
| 2024 | $4,643 | $130,120 | $19,040 | $111,080 |
| 2023 | $4,502 | $125,320 | $12,400 | $112,920 |
| 2022 | $2,964 | $110,120 | $12,400 | $97,720 |
| 2021 | $2,962 | $94,880 | $12,400 | $82,480 |
| 2020 | $2,965 | $94,960 | $12,400 | $82,560 |
| 2019 | $2,979 | $94,960 | $12,400 | $82,560 |
| 2018 | $2,995 | $94,960 | $12,400 | $82,560 |
| 2017 | $3,009 | $94,960 | $12,400 | $82,560 |
| 2016 | $2,996 | $94,960 | $12,400 | $82,560 |
| 2015 | $3,001 | $94,960 | $12,400 | $82,560 |
| 2014 | $3,006 | $94,960 | $12,400 | $82,560 |
| 2013 | -- | $94,960 | $12,400 | $82,560 |
Source: Public Records
Map
Nearby Homes
- 248 Shantz Way
- 248 Shantz Way Unit (LOT A41)
- 305 Shantz Way
- The McGinnis Plan at Bryson Farms
- The Lawson Plan at Bryson Farms
- The Coleman Plan at Bryson Farms
- The Piedmont Plan at Bryson Farms
- The Harrington Plan at Bryson Farms
- 305 Shantz Way Unit (LOT C11)
- The Benson II Plan at Bryson Farms
- The Bradley Plan at Bryson Farms
- 0 Peavy Rd
- 106 Christopher Dr
- 476 Walker Rd
- 250 Shantz Way
- 250 Shantz Way Unit LOT A42
- 135 Abelia Ln
- 252 Shantz Way Unit (LOT A43)
- 123 Early Dr
- 114 Early Dr
- 127 S Live Oak Ct
- 135 S Live Oak Ct
- 190 Red Oak Rd
- 124 S Live Oak Ct
- 188 Red Oak Rd
- 194 Red Oak Rd
- 104 Willow Oak Way
- 108 Willow Oak Way
- 184 Red Oak Rd
- 173 Majestic Oak Cir
- 100 Willow Oak Way
- 108 Live Oak Ln
- 118 S Live Oak Ct
- 117 Live Oak Ln
- 180 Red Oak Rd
- 110 Willow Oak Way
- 169 Majestic Oak Cir
- 169 Majestic Oak Cir Unit 12
- 115 Live Oak Ln
- 119 S Live Oak Ct