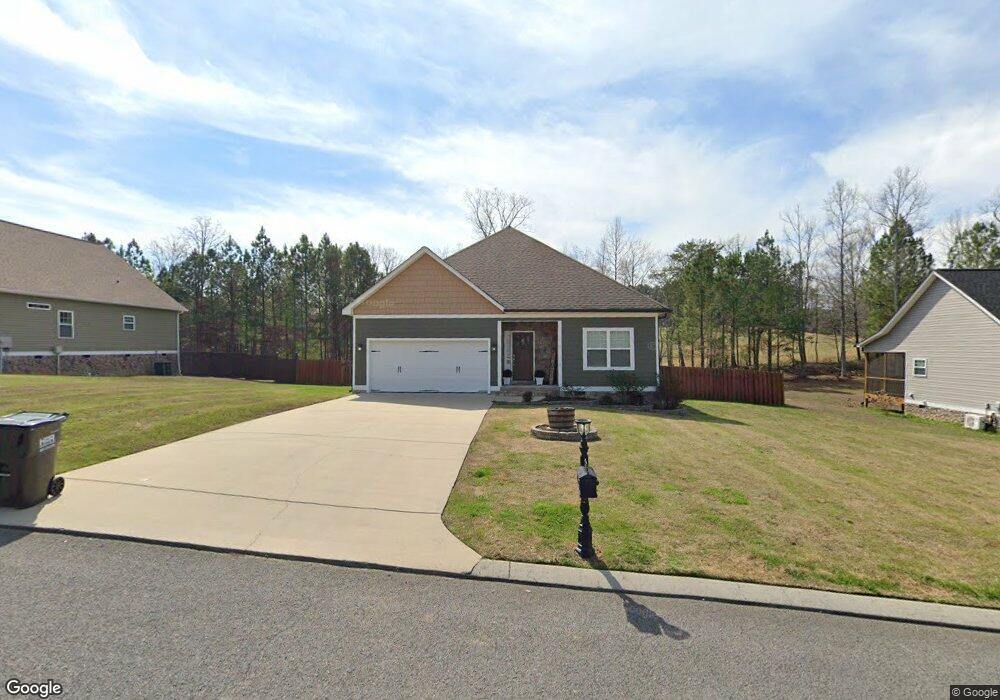
131 Senduro Pass Unit Lot 5 Rock Spring, GA 30739
Rock Spring NeighborhoodEstimated Value: $329,436 - $501,000
3
Beds
3
Baths
1,516
Sq Ft
$250/Sq Ft
Est. Value
About This Home
This home is located at 131 Senduro Pass Unit Lot 5, Rock Spring, GA 30739 and is currently estimated at $378,859, approximately $249 per square foot. 131 Senduro Pass Unit Lot 5 is a home located in Walker County with nearby schools including Rock Spring Elementary School and Lafayette High School.
Ownership History
Date
Name
Owned For
Owner Type
Purchase Details
Closed on
Feb 17, 2023
Sold by
Marson Steven James
Bought by
Tucker Autumn M
Current Estimated Value
Home Financials for this Owner
Home Financials are based on the most recent Mortgage that was taken out on this home.
Original Mortgage
$287,400
Outstanding Balance
$278,086
Interest Rate
6.15%
Mortgage Type
VA
Estimated Equity
$100,773
Purchase Details
Closed on
Jun 29, 2018
Sold by
Hudco Llc
Bought by
Marson Steven James and Misner Catherine Ann
Home Financials for this Owner
Home Financials are based on the most recent Mortgage that was taken out on this home.
Original Mortgage
$184,103
Interest Rate
4.99%
Mortgage Type
FHA
Purchase Details
Closed on
Jul 27, 2017
Sold by
Not Provided
Bought by
Hudco Llc
Purchase Details
Closed on
Dec 5, 2002
Bought by
Parker Henry A and Parker William L
Create a Home Valuation Report for This Property
The Home Valuation Report is an in-depth analysis detailing your home's value as well as a comparison with similar homes in the area
Home Values in the Area
Average Home Value in this Area
Purchase History
| Date | Buyer | Sale Price | Title Company |
|---|---|---|---|
| Tucker Autumn M | $293,148 | -- | |
| Marson Steven James | $187,500 | -- | |
| Hudco Llc | $700,000 | -- | |
| Parker Henry A | $119,500 | -- |
Source: Public Records
Mortgage History
| Date | Status | Borrower | Loan Amount |
|---|---|---|---|
| Open | Tucker Autumn M | $287,400 | |
| Previous Owner | Marson Steven James | $184,103 |
Source: Public Records
Tax History Compared to Growth
Tax History
| Year | Tax Paid | Tax Assessment Tax Assessment Total Assessment is a certain percentage of the fair market value that is determined by local assessors to be the total taxable value of land and additions on the property. | Land | Improvement |
|---|---|---|---|---|
| 2024 | $2,493 | $122,192 | $14,000 | $108,192 |
| 2023 | $2,452 | $108,119 | $14,000 | $94,119 |
| 2022 | $2,619 | $106,198 | $14,000 | $92,198 |
| 2021 | $2,507 | $91,577 | $14,000 | $77,577 |
| 2020 | $2,075 | $72,054 | $14,000 | $58,054 |
| 2019 | $2,114 | $72,054 | $14,000 | $58,054 |
| 2018 | $1,823 | $68,886 | $14,000 | $54,886 |
| 2017 | $200 | $6,700 | $6,700 | $0 |
| 2016 | $164 | $6,700 | $6,700 | $0 |
| 2015 | $175 | $6,700 | $6,700 | $0 |
| 2014 | $169 | $6,700 | $6,700 | $0 |
| 2013 | -- | $6,700 | $6,700 | $0 |
Source: Public Records
Map
Nearby Homes
- 1121 Arnold Rd
- 788 Long Hollow Rd
- 195 Honeysuckle Dr
- 59 Honeysuckle Dr
- 1476 Arnold Rd
- 36 Pheonix Cir
- 285 Cooper Rd
- 386 Twelve Oaks Dr
- 1902 Long Hollow Rd
- 294 E Long Hollow Rd
- 375 Cooper Rd
- 183 Long Hollow Rd
- 918 Old Lafayette Rd
- 103 Deer Ridge Ln
- 70 Deer Ridge Ln
- 200 Hunting Ridge Cir
- 30 Hunting Ridge Cir
- 124 Fieldstone Commons
- 54 Cedar Farm Ln
- 453 Harvest Ln
- 131 Senduro Pass
- 131 Senduro Pass Unit Lot 5
- 131 Senduro Pass Unit Lot 6
- 131 Senduro Pass
- 111 Senduro Pass
- 111 Senduro Pass Unit Lot 5
- 151 Senduro Pass
- 103 Senduro Pass Rd
- 103 Senduro Pass Unit 51
- 103 Senduro Pass
- 103 Senduro Pass
- 103 Senduro Pass Unit 51
- 173 Senduro Pass
- 0 Senduro Pass Rd Unit 8272758
- 0 Senduro Pass Rd Unit 8264513
- 0 Senduro Pass Rd Unit 8264496
- 132 Senduro Pass
- 112 Senduro Pass
- 154 Senduro Pass
- 83 Senduro Pass Unit Lot 3