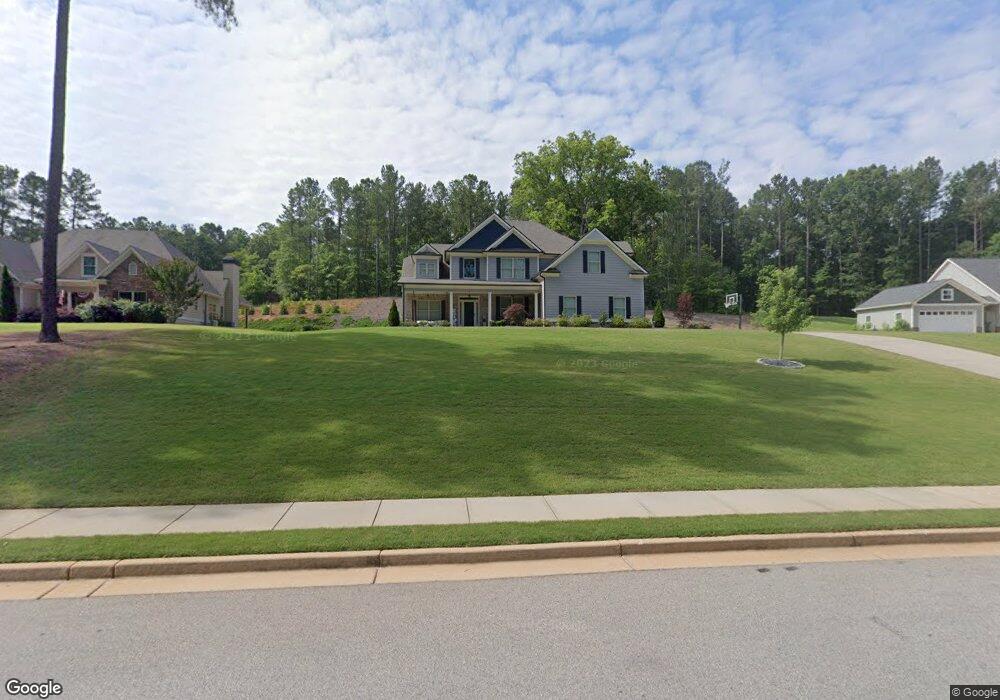
131 Shoals Creek Ln Rutledge, GA 30663
Estimated Value: $524,814 - $664,000
4
Beds
3
Baths
2,892
Sq Ft
$206/Sq Ft
Est. Value
About This Home
This home is located at 131 Shoals Creek Ln, Rutledge, GA 30663 and is currently estimated at $596,454, approximately $206 per square foot. 131 Shoals Creek Ln is a home located in Morgan County with nearby schools including Morgan County Primary School, Morgan County Elementary School, and Morgan County Middle School.
Ownership History
Date
Name
Owned For
Owner Type
Purchase Details
Closed on
Aug 13, 2021
Sold by
Winston Nancy R
Bought by
Breedlove Judy B
Current Estimated Value
Purchase Details
Closed on
Aug 21, 2019
Sold by
Hidden Falls Development Llc
Bought by
Burdette Josh and Burdette Kori
Home Financials for this Owner
Home Financials are based on the most recent Mortgage that was taken out on this home.
Original Mortgage
$274,725
Interest Rate
5.25%
Mortgage Type
FHA
Purchase Details
Closed on
May 11, 2017
Bought by
270 South Main Llc
Purchase Details
Closed on
Aug 16, 2014
Sold by
Smith Jerry O
Bought by
Hidden Falls Development Llc
Purchase Details
Closed on
Sep 30, 2011
Sold by
Synovus Bank
Bought by
Smith Jerry
Purchase Details
Closed on
Feb 1, 2011
Sold by
Rutledge Land Development Llc
Bought by
Bank Of North Georgia
Create a Home Valuation Report for This Property
The Home Valuation Report is an in-depth analysis detailing your home's value as well as a comparison with similar homes in the area
Home Values in the Area
Average Home Value in this Area
Purchase History
| Date | Buyer | Sale Price | Title Company |
|---|---|---|---|
| Breedlove Judy B | -- | -- | |
| Burdette Josh | $307,000 | -- | |
| 270 South Main Llc | -- | -- | |
| Hidden Falls Development Llc | -- | -- | |
| Smith Jerry | $198,000 | -- | |
| Bank Of North Georgia | -- | -- |
Source: Public Records
Mortgage History
| Date | Status | Borrower | Loan Amount |
|---|---|---|---|
| Previous Owner | Burdette Josh | $274,725 |
Source: Public Records
Tax History Compared to Growth
Tax History
| Year | Tax Paid | Tax Assessment Tax Assessment Total Assessment is a certain percentage of the fair market value that is determined by local assessors to be the total taxable value of land and additions on the property. | Land | Improvement |
|---|---|---|---|---|
| 2025 | $4,260 | $188,325 | $18,400 | $169,925 |
| 2024 | $4,329 | $169,532 | $14,400 | $155,132 |
| 2023 | $3,901 | $148,419 | $14,400 | $134,019 |
| 2022 | $3,849 | $140,922 | $14,400 | $126,522 |
| 2021 | $3,563 | $130,034 | $12,600 | $117,434 |
| 2020 | $3,444 | $130,034 | $12,600 | $117,434 |
| 2019 | $3,846 | $135,026 | $12,600 | $122,426 |
| 2018 | $3,729 | $129,097 | $12,600 | $116,497 |
| 2017 | $369 | $12,600 | $12,600 | $0 |
| 2016 | $301 | $10,000 | $10,000 | $0 |
| 2015 | $305 | $10,000 | $10,000 | $0 |
| 2014 | $80 | $2,680 | $2,680 | $0 |
| 2013 | -- | $1,960 | $1,960 | $0 |
Source: Public Records
Map
Nearby Homes
- 120 Hidden Falls Ct
- 224 Hollis St
- 0 Hawkins Academy Rd Unit 10561655
- 5761 W Dixie Hwy
- 0 Fairplay St Unit 10637174
- 5521 Atlanta Hwy
- 294 Tuscany Dr
- 5841 Atlanta Hwy
- 0 Reese Rd Unit 10622381
- 0 Reese Rd Unit 25651133
- 0 W Dixie Hwy Unit 10499573
- 5187 Parkview Rd
- 1151 Fears Rd
- 25 Browning Shoals Rd
- 745 Amber Lakes Ct Unit 2
- 3641 Davis Academy Rd
- 1310 Knox Chapel Rd
- 2535 Willow Ln
- 1550 Knox Chapel Rd
- 0 Browning Shoals Rd Unit 7392331
- 131 Shoals Creek Ln Unit 35
- 121 Shoals Creek Ln Unit Lot 36
- 121 Hidden Falls Ct
- 111 Hidden Falls Ct
- 272 W Main St
- 111 Shoals Creek Ln
- 131 Hidden Falls Ct
- 282 W Main St
- 130 Shoals Creek Ln
- 141 Hidden Springs Dr
- 248 W Main St
- 151 Shoals Creek Ln
- 140 Shoals Creek Ln
- 151 Hidden Springs Dr Unit 38
- 151 Hidden Springs Dr
- 110 Shoals Creek Ln Unit 23
- 277 W Main St
- 120 Hidden Falls Ct Unit 31
- 265 W Main St
- 318 W Main St