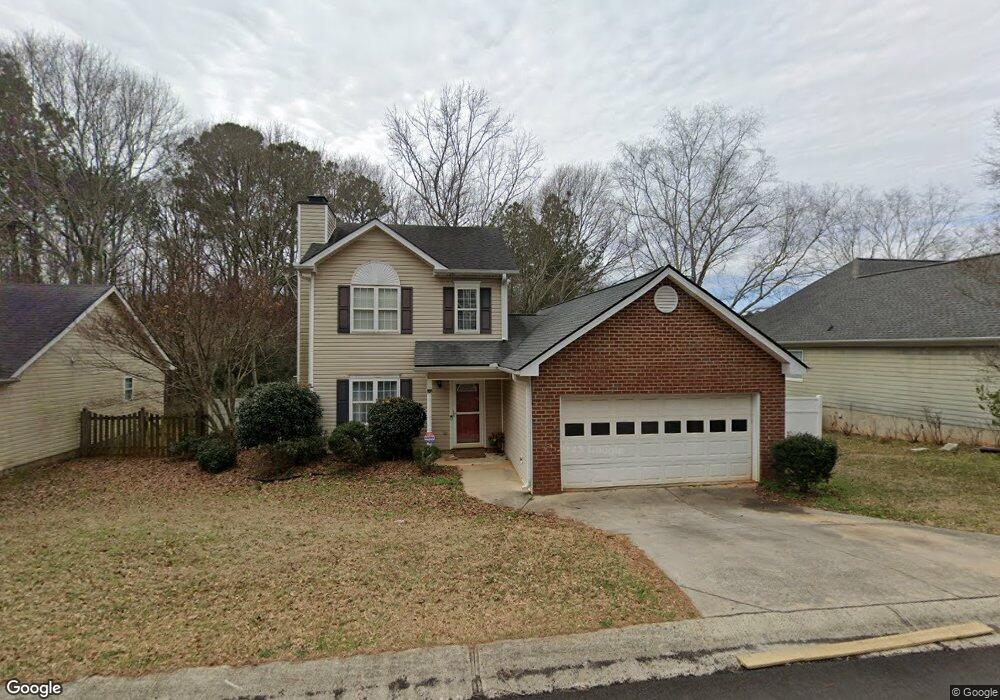
131 Spring Lake Dr Athens, GA 30605
Cedar Creek NeighborhoodEstimated Value: $316,277 - $332,000
3
Beds
3
Baths
1,520
Sq Ft
$214/Sq Ft
Est. Value
About This Home
This home is located at 131 Spring Lake Dr, Athens, GA 30605 and is currently estimated at $324,819, approximately $213 per square foot. 131 Spring Lake Dr is a home located in Clarke County with nearby schools including Hilsman Middle School, Cedar Shoals High School, and Athens Montessori School.
Ownership History
Date
Name
Owned For
Owner Type
Purchase Details
Closed on
Feb 26, 2008
Sold by
Ngigi Isaac
Bought by
Njoroge Anne
Current Estimated Value
Purchase Details
Closed on
Mar 23, 2005
Sold by
Fountain Kathryn D
Bought by
Njoroge I Isaac and Njoroge Anne N
Home Financials for this Owner
Home Financials are based on the most recent Mortgage that was taken out on this home.
Original Mortgage
$147,682
Interest Rate
5.62%
Mortgage Type
FHA
Purchase Details
Closed on
Aug 25, 2000
Sold by
Shiver Homes Inc
Bought by
Fountain Kathryn D
Purchase Details
Closed on
Aug 24, 1999
Sold by
Springlake L P
Bought by
Shiver Homes Inc
Purchase Details
Closed on
Aug 2, 1999
Sold by
Shaw Charles B
Bought by
Springlake L P
Purchase Details
Closed on
Apr 30, 1996
Sold by
Springlake L P
Bought by
Shaw Charles B
Purchase Details
Closed on
Sep 4, 1995
Sold by
Broun Conway C
Bought by
Springlake L P
Create a Home Valuation Report for This Property
The Home Valuation Report is an in-depth analysis detailing your home's value as well as a comparison with similar homes in the area
Home Values in the Area
Average Home Value in this Area
Purchase History
| Date | Buyer | Sale Price | Title Company |
|---|---|---|---|
| Njoroge Anne | -- | -- | |
| Njoroge I Isaac | $150,000 | -- | |
| Fountain Kathryn D | $127,800 | -- | |
| Shiver Homes Inc | $50,300 | -- | |
| Springlake L P | -- | -- | |
| Shaw Charles B | $34,000 | -- | |
| Springlake L P | -- | -- |
Source: Public Records
Mortgage History
| Date | Status | Borrower | Loan Amount |
|---|---|---|---|
| Previous Owner | Njoroge I Isaac | $147,682 |
Source: Public Records
Tax History Compared to Growth
Tax History
| Year | Tax Paid | Tax Assessment Tax Assessment Total Assessment is a certain percentage of the fair market value that is determined by local assessors to be the total taxable value of land and additions on the property. | Land | Improvement |
|---|---|---|---|---|
| 2025 | $2,969 | $112,801 | $12,000 | $100,801 |
| 2024 | $2,969 | $109,560 | $12,000 | $97,560 |
| 2023 | $2,045 | $100,436 | $10,400 | $90,036 |
| 2022 | $2,465 | $87,262 | $10,400 | $76,862 |
| 2021 | $1,997 | $69,255 | $10,400 | $58,855 |
| 2020 | $1,848 | $64,829 | $10,400 | $54,429 |
| 2019 | $1,662 | $58,961 | $10,400 | $48,561 |
| 2018 | $1,525 | $54,924 | $10,400 | $44,524 |
| 2017 | $1,418 | $51,760 | $10,400 | $41,360 |
| 2016 | $1,348 | $49,710 | $10,400 | $39,310 |
| 2015 | $1,323 | $48,887 | $10,400 | $38,487 |
| 2014 | $1,331 | $49,067 | $10,400 | $38,667 |
Source: Public Records
Map
Nearby Homes
- 119 Spring Lake Dr
- 255 Cedar Creek Dr
- 169 Spring Lake Dr
- 125 Saint Andrews Ct
- 125 Broomsedge Trail
- 200 Scandia Cir Unit 5
- 1283 Cedar Shoals Dr
- 450 Gaines School Rd
- 400 Greencrest Dr
- 354 Greencrest Dr
- 352 Greencrest Dr
- 100 Ansonborough Ln Unit 403
- 100 Ansonborough Ln Unit 601
- 245 Cedar Springs Dr
- 219 Georgetown Dr
- 430 Forest Rd
- Lot 1 B Spring Lake Dr
- 135 Spring Lake Dr
- 125 Spring Lake Dr
- 125 Spring Lake Dr
- 139 Spring Lake Dr
- 142 Spring Lake Dr
- 134 Spring Lake Dr
- 132 Spring Lake Dr
- 146 Spring Lake Dr
- 143 Spring Lake Dr
- 315 Spring Lake Ct
- 121 Spring Lake Dr
- 325 Spring Lake Ct
- 305 Spring Lake Ct
- 335 Spring Lake Ct
- 147 Spring Lake Dr
- 291 E Paces Dr
- 345 Spring Lake Ct
- 119 Vintage Ct Unit 121