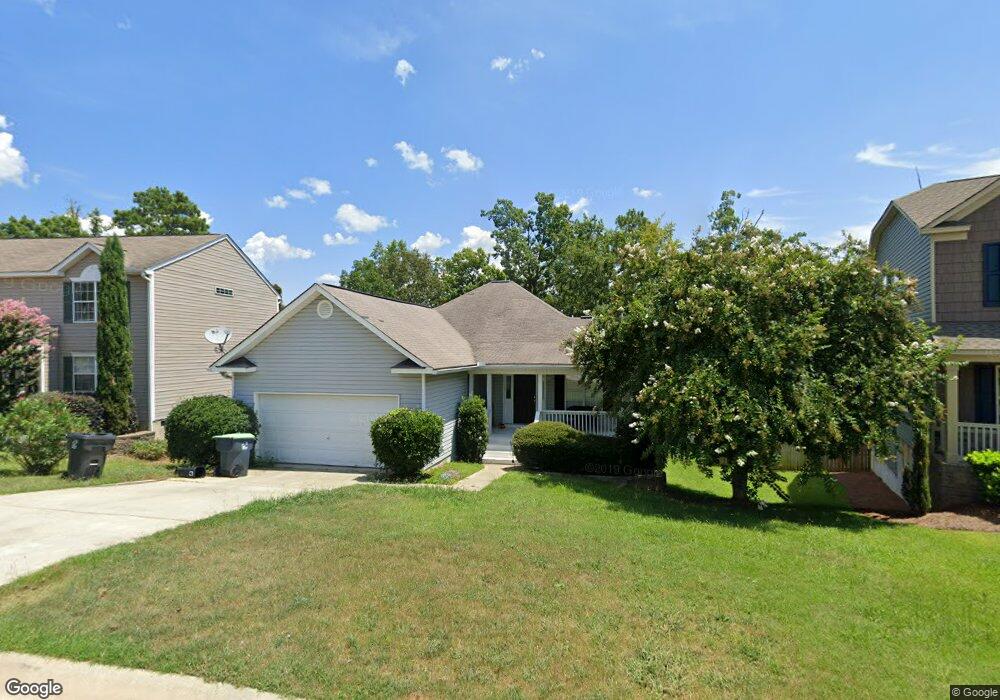
131 Stoney Pointe Dr Chapin, SC 29036
Estimated Value: $207,000 - $313,000
4
Beds
3
Baths
2,630
Sq Ft
$103/Sq Ft
Est. Value
About This Home
This home is located at 131 Stoney Pointe Dr, Chapin, SC 29036 and is currently estimated at $271,463, approximately $103 per square foot. 131 Stoney Pointe Dr is a home located in Lexington County with nearby schools including Chapin Elementary School, Chapin Intermediate, and Chapin High School.
Ownership History
Date
Name
Owned For
Owner Type
Purchase Details
Closed on
Oct 15, 2018
Sold by
Browning Anthony and Browning Tiffany
Bought by
Browning Holdings Llc
Current Estimated Value
Purchase Details
Closed on
Jun 8, 2017
Sold by
Flynn Cynthia
Bought by
Browning Anthony and Browning Tiffany
Purchase Details
Closed on
May 24, 2007
Sold by
Flynn Cynthia
Bought by
Browning Anthony and Browning Tiffany
Home Financials for this Owner
Home Financials are based on the most recent Mortgage that was taken out on this home.
Original Mortgage
$129,975
Interest Rate
6.17%
Mortgage Type
Purchase Money Mortgage
Purchase Details
Closed on
Mar 27, 1998
Sold by
Browning Holdings Llc
Bought by
Lambert Michael Brandon
Create a Home Valuation Report for This Property
The Home Valuation Report is an in-depth analysis detailing your home's value as well as a comparison with similar homes in the area
Home Values in the Area
Average Home Value in this Area
Purchase History
| Date | Buyer | Sale Price | Title Company |
|---|---|---|---|
| Browning Holdings Llc | -- | None Available | |
| Browning Anthony | -- | None Available | |
| Browning Anthony | $162,500 | None Available | |
| Lambert Michael Brandon | $170,000 | None Listed On Document |
Source: Public Records
Mortgage History
| Date | Status | Borrower | Loan Amount |
|---|---|---|---|
| Previous Owner | Browning Anthony | $129,975 |
Source: Public Records
Tax History
| Year | Tax Paid | Tax Assessment Tax Assessment Total Assessment is a certain percentage of the fair market value that is determined by local assessors to be the total taxable value of land and additions on the property. | Land | Improvement |
|---|---|---|---|---|
| 2024 | $1,120 | $6,800 | $1,000 | $5,800 |
| 2023 | $1,040 | $6,800 | $1,000 | $5,800 |
| 2020 | $5,391 | $11,680 | $1,500 | $10,180 |
| 2019 | $4,478 | $10,341 | $1,200 | $9,141 |
| 2018 | $4,271 | $10,341 | $1,200 | $9,141 |
| 2017 | $4,237 | $10,341 | $1,200 | $9,141 |
| 2016 | $4,206 | $10,340 | $1,200 | $9,140 |
| 2014 | $4,275 | $10,962 | $1,500 | $9,462 |
| 2013 | -- | $9,870 | $1,200 | $8,670 |
Source: Public Records
Map
Nearby Homes
- 134 Walkbridge Way
- 141 Palm St
- 180 Palm St
- 192 Palm St
- 0 Dreher Island Rd Unit 21647709
- 0 Dreher Island Rd Unit 587193
- 409 Dutchman Shores Cir
- 188 Kerry Gibbons Dr
- 147 Ventnor Ave
- 151 Ventnor Ave
- 229 Dutchman Shores Cir
- 190 Elm Creek Dr
- 392 Eagle Pointe Dr
- 108 Pennsylvania Ct
- 171 Elm Creek Dr
- 512 Stucks Point Dr
- 160 State Road S-32-716
- 132 Northshore Dr
- 524 Murray Lindler Rd
- 125 Northshore Dr
- 131 Stoney Point Dr
- 127 Stoney Pointe Dr
- 135 Stoney Pointe Dr
- 139 Stoney Point Dr
- 123 Stoney Pointe Dr
- 139 Stoney Pointe Dr
- 143 Stoney Pointe Dr
- 128 Stoney Pointe Dr
- 136 Stoney Pointe Dr
- 119 Stoney Point Dr
- 124 Stoney Pointe Dr
- 147 Stoney Pointe Dr
- 144 Stoney Pointe Dr
- 240 Stoney Pointe Dr
- 111 Stoney Pointe Dr
- 155 Stoney Pointe Dr
- 265 Stoney Pointe Dr
- 236 Stoney Pointe Dr
- 111 Stoney Point Dr
- 91 Stoney Pointe Dr
Your Personal Tour Guide
Ask me questions while you tour the home.