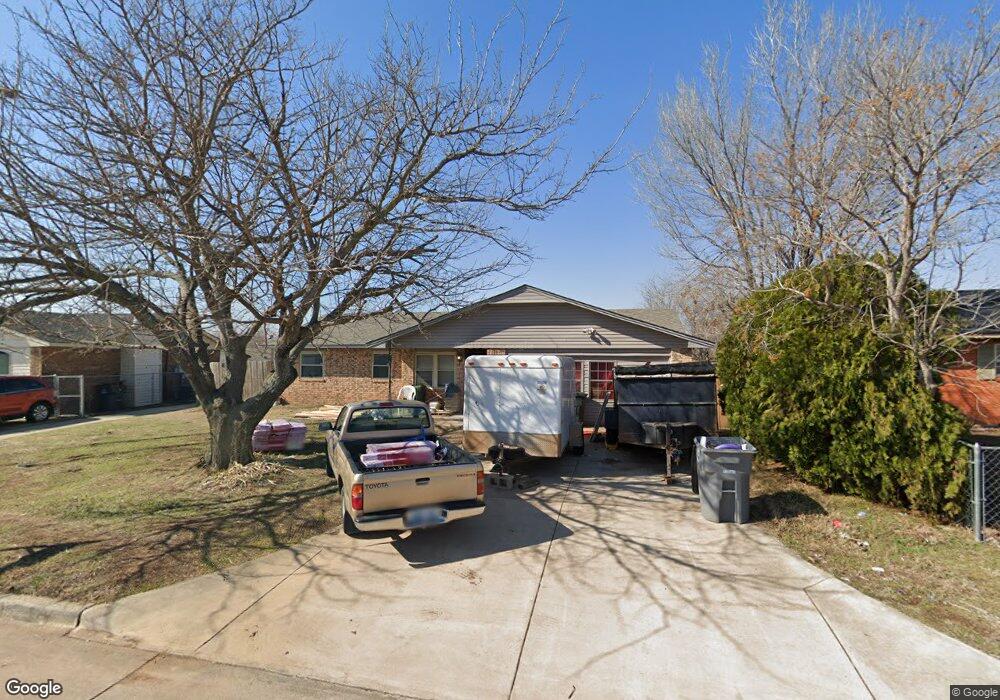
131 SW 68th St Lawton, OK 73505
Almor West NeighborhoodEstimated Value: $153,000 - $165,000
3
Beds
2
Baths
1,700
Sq Ft
$92/Sq Ft
Est. Value
About This Home
This home is located at 131 SW 68th St, Lawton, OK 73505 and is currently estimated at $156,261, approximately $91 per square foot. 131 SW 68th St is a home located in Comanche County with nearby schools including Almor West Elementary School, Eisenhower Middle School, and Eisenhower High School.
Ownership History
Date
Name
Owned For
Owner Type
Purchase Details
Closed on
Sep 23, 2024
Sold by
Hisle Investments Inc
Bought by
Walker Brandon L
Current Estimated Value
Home Financials for this Owner
Home Financials are based on the most recent Mortgage that was taken out on this home.
Original Mortgage
$160,755
Outstanding Balance
$158,747
Interest Rate
6.35%
Mortgage Type
VA
Estimated Equity
-$2,486
Purchase Details
Closed on
Oct 15, 2019
Sold by
Hisle Walden D and Hisle Glada M
Bought by
Hisle Investments Inc
Purchase Details
Closed on
Aug 17, 2009
Sold by
Moody David T and Moody Amy
Bought by
Hisle Walden D and Eisle Glada M
Home Financials for this Owner
Home Financials are based on the most recent Mortgage that was taken out on this home.
Original Mortgage
$66,000
Interest Rate
5.19%
Mortgage Type
Future Advance Clause Open End Mortgage
Purchase Details
Closed on
Jan 6, 2000
Sold by
Sec Of Veterans Affairs
Purchase Details
Closed on
Apr 13, 1999
Sold by
Rachel Melvin T and Rachel Jeanette
Create a Home Valuation Report for This Property
The Home Valuation Report is an in-depth analysis detailing your home's value as well as a comparison with similar homes in the area
Home Values in the Area
Average Home Value in this Area
Purchase History
| Date | Buyer | Sale Price | Title Company |
|---|---|---|---|
| Walker Brandon L | $162,000 | Nations Title | |
| Hisle Investments Inc | -- | None Available | |
| Hisle Walden D | $52,000 | -- | |
| -- | -- | -- | |
| -- | -- | -- |
Source: Public Records
Mortgage History
| Date | Status | Borrower | Loan Amount |
|---|---|---|---|
| Open | Walker Brandon L | $160,755 | |
| Previous Owner | Hisle Walden D | $66,000 |
Source: Public Records
Tax History Compared to Growth
Tax History
| Year | Tax Paid | Tax Assessment Tax Assessment Total Assessment is a certain percentage of the fair market value that is determined by local assessors to be the total taxable value of land and additions on the property. | Land | Improvement |
|---|---|---|---|---|
| 2025 | $1,125 | $18,452 | $2,925 | $15,527 |
| 2024 | $1,125 | $15,041 | $2,925 | $12,116 |
| 2023 | $1,125 | $9,903 | $1,688 | $8,215 |
| 2022 | $1,055 | $9,903 | $1,688 | $8,215 |
| 2021 | $1,030 | $10,068 | $1,688 | $8,380 |
| 2020 | $993 | $9,763 | $1,688 | $8,075 |
| 2019 | $939 | $9,299 | $1,688 | $7,611 |
| 2018 | $981 | $9,850 | $1,688 | $8,162 |
| 2017 | $843 | $9,850 | $1,688 | $8,162 |
| 2016 | $927 | $10,549 | $1,181 | $9,368 |
| 2015 | $1,010 | $10,549 | $1,181 | $9,368 |
| 2014 | $1,003 | $10,549 | $1,181 | $9,368 |
Source: Public Records
Map
Nearby Homes
- 6913 SW Delta Ave
- 6704 SW Delta Cir
- 510 SW 70th St
- 152 SW 69th St
- 404 SW 71st St
- 10 SW 69th St
- 6929 SW Hampshire Cir
- 6914 SW Forest Ave
- 341 SW 71st St
- 6919 SW Hampshire Cir
- 304 SW 72nd St
- 6767 SW Chaucer Dr
- 6914 NW Eisenhower Dr
- 220 SW 76th St
- 7502 SW Forest Ave
- 6935 NW Eisenhower Dr
- 6821 SW Fenwick Ave
- 305 NW Tanglewood Cir
- 205 NW 74th St
- 7606 SW Cherokee Ave