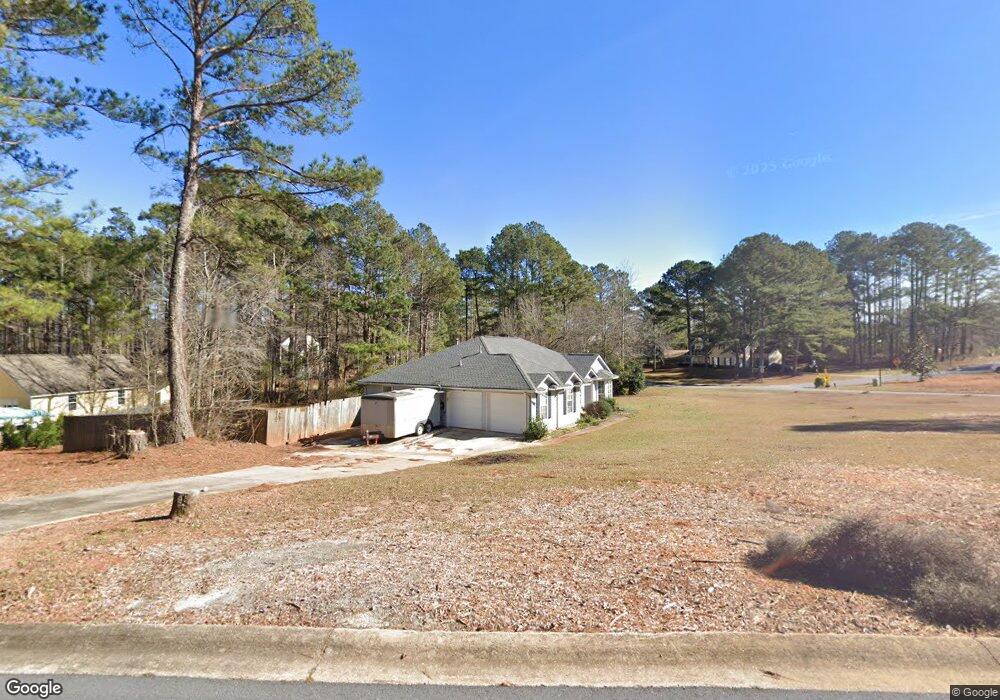
131 Timber Walk Dr Sharpsburg, GA 30277
Estimated Value: $331,125 - $368,000
3
Beds
2
Baths
1,820
Sq Ft
$192/Sq Ft
Est. Value
About This Home
This home is located at 131 Timber Walk Dr, Sharpsburg, GA 30277 and is currently estimated at $350,031, approximately $192 per square foot. 131 Timber Walk Dr is a home located in Coweta County with nearby schools including Thomas Crossroads Elementary School, Lee Middle School, and Northgate High School.
Ownership History
Date
Name
Owned For
Owner Type
Purchase Details
Closed on
Mar 22, 2004
Sold by
Lanci Max C
Bought by
Lanci Max C and Lanci Despina
Current Estimated Value
Home Financials for this Owner
Home Financials are based on the most recent Mortgage that was taken out on this home.
Original Mortgage
$130,500
Outstanding Balance
$60,310
Interest Rate
5.62%
Mortgage Type
New Conventional
Estimated Equity
$289,721
Purchase Details
Closed on
Aug 10, 1998
Sold by
Gonzalez Salvador and Gonzalez Lydia
Bought by
Lanci Max C
Home Financials for this Owner
Home Financials are based on the most recent Mortgage that was taken out on this home.
Original Mortgage
$90,900
Interest Rate
6.97%
Mortgage Type
New Conventional
Purchase Details
Closed on
Oct 25, 1990
Bought by
Gonzalez Salvador
Purchase Details
Closed on
Apr 5, 1990
Bought by
Heritage Homes Of Co
Purchase Details
Closed on
Mar 31, 1985
Bought by
Eads Walter
Create a Home Valuation Report for This Property
The Home Valuation Report is an in-depth analysis detailing your home's value as well as a comparison with similar homes in the area
Home Values in the Area
Average Home Value in this Area
Purchase History
| Date | Buyer | Sale Price | Title Company |
|---|---|---|---|
| Lanci Max C | -- | -- | |
| Lanci Max C | $115,900 | -- | |
| Gonzalez Salvador | $86,000 | -- | |
| Heritage Homes Of Co | $237,500 | -- | |
| Eads Walter | $87,600 | -- |
Source: Public Records
Mortgage History
| Date | Status | Borrower | Loan Amount |
|---|---|---|---|
| Open | Lanci Max C | $130,500 | |
| Previous Owner | Lanci Max C | $90,900 |
Source: Public Records
Tax History Compared to Growth
Tax History
| Year | Tax Paid | Tax Assessment Tax Assessment Total Assessment is a certain percentage of the fair market value that is determined by local assessors to be the total taxable value of land and additions on the property. | Land | Improvement |
|---|---|---|---|---|
| 2025 | $3,015 | $125,577 | $24,000 | $101,577 |
| 2024 | $2,844 | $120,428 | $20,000 | $100,428 |
| 2023 | $2,844 | $106,072 | $18,000 | $88,072 |
| 2022 | $2,564 | $102,118 | $18,000 | $84,118 |
| 2021 | $2,121 | $78,759 | $16,000 | $62,759 |
| 2020 | $2,135 | $78,759 | $16,000 | $62,759 |
| 2019 | $1,709 | $56,763 | $10,000 | $46,763 |
| 2018 | $1,712 | $56,763 | $10,000 | $46,763 |
| 2017 | $1,712 | $56,763 | $10,000 | $46,763 |
| 2016 | $1,692 | $56,763 | $10,000 | $46,763 |
| 2015 | $1,597 | $54,425 | $10,000 | $44,425 |
| 2014 | $1,585 | $54,425 | $10,000 | $44,425 |
Source: Public Records
Map
Nearby Homes
- 5 Timber Walk Place
- 160 Old Field Rd
- 90 Spring Forest Trail
- 20 Platinum Ridge
- 0 Spring Forest Way Unit LOT 2-1 10483749
- Spring Forest Way Lot: 2-1
- 150 Park Timbers Dr
- 435 Mapledale Trail
- 185 Grand Jct
- 3771 Highway 34 E Unit TRACT2
- 3771 Highway 34 E Unit TRACT1
- 0 Pinegate Way Unit 10436279
- 430 Mapledale Trail
- 185 Mapledale Trail
- 165 Bartlett Dr
- 85 Holly Springs Rd
- 4791 Highway 34 E
- 160 Maple Leaf Rd
- 374 Beaumont Farms Dr
- 190 Willow Lake Ln
- 147 Timber Walk Dr
- 79 Timber Walk Dr
- 132 Timber Walk Dr
- 10 Timber Walk Dr
- 10 Timber Walk Way
- 142 Timber Walk Dr
- 5 Timber Walk Way
- 5 Timber Walk Way Unit 5
- 10 Timber Walk Place
- 155 Timber Walk Dr
- 152 Timber Walk Dr
- 55 Timber Walk Dr
- 76 Timber Walk Dr
- 15 Timber Walk Place
- 25 Timber Walk Place
- 20 Timber Walk Place
- 165 Timber Walk Dr
- 39 Timber Walk Dr
- 70 Timber Walk Dr
- 166 Timber Walk Dr