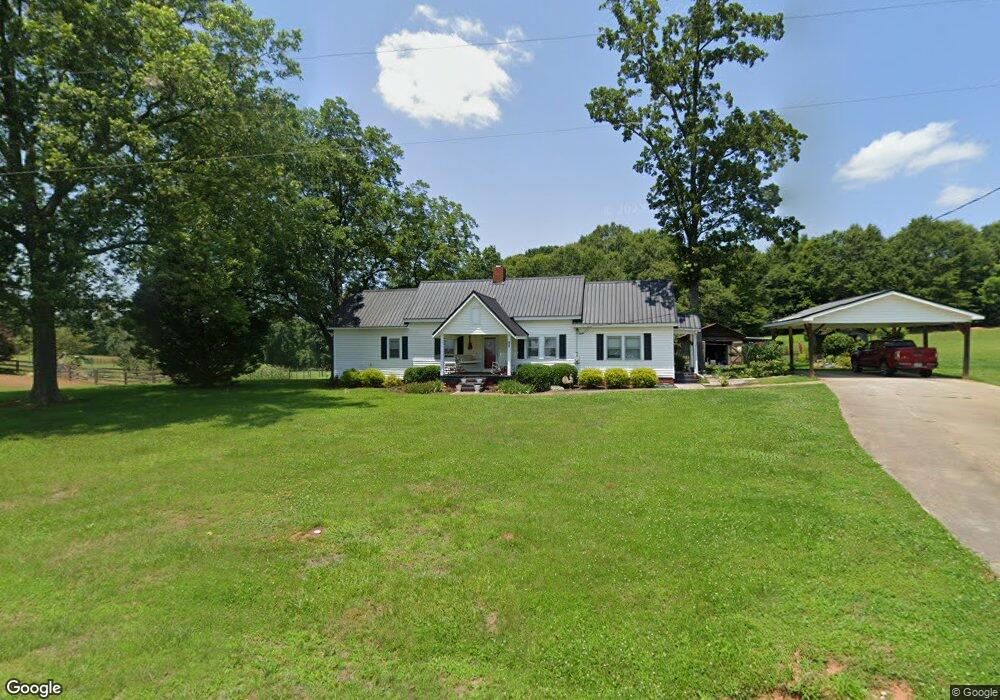
131 Y Z Sailors Rd Jefferson, GA 30549
Estimated Value: $291,055 - $396,000
2
Beds
1
Bath
1,184
Sq Ft
$285/Sq Ft
Est. Value
About This Home
This home is located at 131 Y Z Sailors Rd, Jefferson, GA 30549 and is currently estimated at $337,514, approximately $285 per square foot. 131 Y Z Sailors Rd is a home located in Jackson County with nearby schools including Satilla Elementary School, East Jackson Elementary School, and East Jackson Middle School.
Ownership History
Date
Name
Owned For
Owner Type
Purchase Details
Closed on
Mar 12, 2010
Sold by
Hall Jeanne B
Bought by
Gibbons Anthony W
Current Estimated Value
Home Financials for this Owner
Home Financials are based on the most recent Mortgage that was taken out on this home.
Original Mortgage
$148,979
Outstanding Balance
$98,493
Interest Rate
4.93%
Mortgage Type
New Conventional
Estimated Equity
$239,021
Purchase Details
Closed on
Aug 16, 2006
Sold by
Not Provided
Bought by
Gibbons Anthony W and Gibbons Tracie D
Home Financials for this Owner
Home Financials are based on the most recent Mortgage that was taken out on this home.
Original Mortgage
$107,200
Interest Rate
6.73%
Mortgage Type
New Conventional
Purchase Details
Closed on
Mar 4, 2005
Sold by
Allen Jessica
Bought by
Collins William L and Collins Jessica E
Home Financials for this Owner
Home Financials are based on the most recent Mortgage that was taken out on this home.
Original Mortgage
$115,200
Interest Rate
5.6%
Mortgage Type
New Conventional
Purchase Details
Closed on
Aug 6, 2003
Sold by
Cook John V
Bought by
Allen Jessica
Purchase Details
Closed on
Dec 31, 1998
Sold by
Sailors Jimmy R
Bought by
Cook John V
Create a Home Valuation Report for This Property
The Home Valuation Report is an in-depth analysis detailing your home's value as well as a comparison with similar homes in the area
Home Values in the Area
Average Home Value in this Area
Purchase History
| Date | Buyer | Sale Price | Title Company |
|---|---|---|---|
| Gibbons Anthony W | $146,000 | -- | |
| Gibbons Anthony W | $134,000 | -- | |
| Collins William L | -- | -- | |
| Allen Jessica | $125,000 | -- | |
| Cook John V | $92,500 | -- |
Source: Public Records
Mortgage History
| Date | Status | Borrower | Loan Amount |
|---|---|---|---|
| Open | Gibbons Anthony W | $148,979 | |
| Previous Owner | Gibbons Anthony W | $107,200 | |
| Previous Owner | Collins William L | $115,200 |
Source: Public Records
Tax History Compared to Growth
Tax History
| Year | Tax Paid | Tax Assessment Tax Assessment Total Assessment is a certain percentage of the fair market value that is determined by local assessors to be the total taxable value of land and additions on the property. | Land | Improvement |
|---|---|---|---|---|
| 2024 | $2,695 | $107,224 | $64,240 | $42,984 |
| 2023 | $2,695 | $102,144 | $64,240 | $37,904 |
| 2022 | $1,501 | $51,624 | $21,840 | $29,784 |
| 2021 | $1,511 | $51,624 | $21,840 | $29,784 |
| 2020 | $1,466 | $45,744 | $21,840 | $23,904 |
| 2019 | $1,488 | $45,744 | $21,840 | $23,904 |
| 2018 | $1,423 | $43,148 | $19,880 | $23,268 |
| 2017 | $1,323 | $40,423 | $18,886 | $21,537 |
| 2016 | $1,330 | $40,423 | $18,886 | $21,537 |
| 2015 | $1,336 | $40,423 | $18,886 | $21,537 |
| 2014 | $1,317 | $39,553 | $18,886 | $20,666 |
| 2013 | -- | $38,161 | $17,494 | $20,666 |
Source: Public Records
Map
Nearby Homes
- 612 Danielsville St
- 924 Brockton Rd
- 199 Montview Dr
- 199 Montview Dr Unit 90
- 166 Montview Dr
- 166 Montview Dr Unit 112
- 223 Montview Dr Unit 92
- 223 Montview Dr
- 184 Montview Dr
- 184 Montview Dr Unit 111
- 372 Glenside Dr
- 372 Glenside Dr Unit 76
- 179 Merwood Ln
- 179 Merwood Ln Unit 125
- O Curry Dr
- 486 Glenside Dr
- 121 Windsor Park Ct
- 125 Windsor Park Ct
- 131 Windsor Park Ct
- 19 Redtail Rd
- 105 Y Z Sailors Rd
- 105 Yz Sailors Rd
- 118 Y Z Sailors Rd
- 207 Yz Sailors Rd
- 180 Y Z Sailors Rd
- 207 Y Z Sailors Rd
- 207 Y Z Sailors Rd
- 65 Y Z Sailors Rd
- 239 Y Z Sailors Rd
- 239 Y Z Sailors Rd Unit 5
- 839 Brockton Rd
- 15 Y Z Sailors Rd
- 724 Brockton Rd
- 607 Danielsville St
- 690 Brockton Rd
- 780 Brockton Rd
- 746 Brockton Rd
- 638 Danielsville St
- 812 Brockton Rd
- 583 Danielsville St