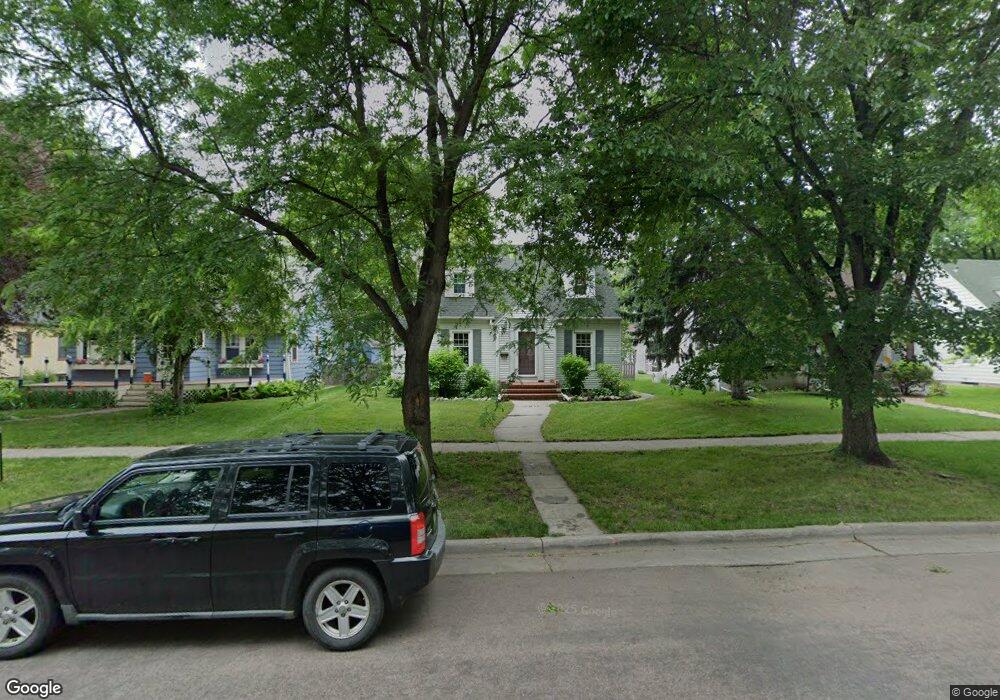
1310 4th St N Fargo, ND 58102
Horace Mann NeighborhoodEstimated Value: $286,000 - $349,000
5
Beds
3
Baths
1,544
Sq Ft
$206/Sq Ft
Est. Value
About This Home
This home is located at 1310 4th St N, Fargo, ND 58102 and is currently estimated at $317,811, approximately $205 per square foot. 1310 4th St N is a home located in Cass County with nearby schools including Horace Mann Roosevelt Elementary School, Ben Franklin Middle School, and North High School.
Ownership History
Date
Name
Owned For
Owner Type
Purchase Details
Closed on
Nov 12, 2010
Sold by
Roberts Aaron and Roberts Carrie
Bought by
Mertz Kelly D and Johnson David K
Current Estimated Value
Home Financials for this Owner
Home Financials are based on the most recent Mortgage that was taken out on this home.
Original Mortgage
$153,020
Outstanding Balance
$100,857
Interest Rate
4.25%
Mortgage Type
FHA
Estimated Equity
$216,954
Create a Home Valuation Report for This Property
The Home Valuation Report is an in-depth analysis detailing your home's value as well as a comparison with similar homes in the area
Home Values in the Area
Average Home Value in this Area
Purchase History
| Date | Buyer | Sale Price | Title Company |
|---|---|---|---|
| Mertz Kelly D | -- | -- |
Source: Public Records
Mortgage History
| Date | Status | Borrower | Loan Amount |
|---|---|---|---|
| Open | Mertz Kelly D | $153,020 |
Source: Public Records
Tax History Compared to Growth
Tax History
| Year | Tax Paid | Tax Assessment Tax Assessment Total Assessment is a certain percentage of the fair market value that is determined by local assessors to be the total taxable value of land and additions on the property. | Land | Improvement |
|---|---|---|---|---|
| 2024 | $3,791 | $141,650 | $22,300 | $119,350 |
| 2023 | $4,159 | $137,500 | $22,300 | $115,200 |
| 2022 | $4,147 | $134,800 | $22,300 | $112,500 |
| 2021 | $3,846 | $126,000 | $22,300 | $103,700 |
| 2020 | $3,644 | $120,000 | $22,300 | $97,700 |
| 2019 | $3,647 | $120,000 | $12,400 | $107,600 |
| 2018 | $3,090 | $100,050 | $12,400 | $87,650 |
| 2017 | $2,895 | $95,300 | $12,400 | $82,900 |
| 2016 | $2,452 | $85,100 | $12,400 | $72,700 |
| 2015 | $2,585 | $85,100 | $9,300 | $75,800 |
| 2014 | $2,840 | $82,800 | $9,300 | $73,500 |
| 2013 | $2,858 | $82,800 | $9,300 | $73,500 |
Source: Public Records
Map
Nearby Homes