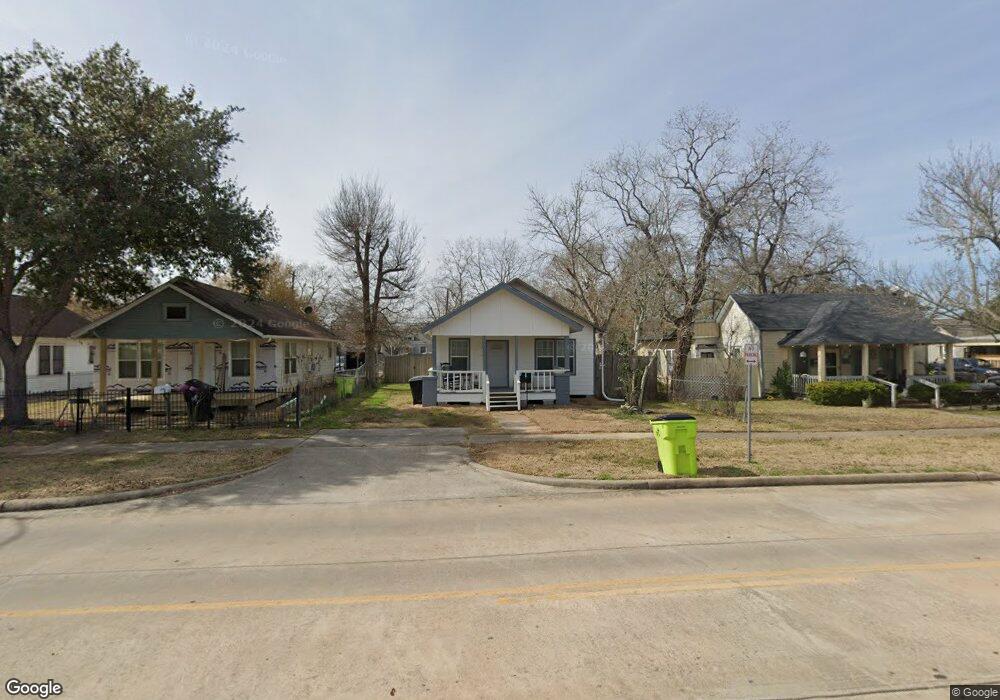
1310 4th St Rosenberg, TX 77471
Estimated Value: $141,910 - $229,000
2
Beds
2
Baths
925
Sq Ft
$189/Sq Ft
Est. Value
About This Home
This home is located at 1310 4th St, Rosenberg, TX 77471 and is currently estimated at $174,637, approximately $188 per square foot. 1310 4th St is a home located in Fort Bend County with nearby schools including Taylor Ray Elementary School, Navarro Middle School, and George Junior High School.
Ownership History
Date
Name
Owned For
Owner Type
Purchase Details
Closed on
Sep 5, 2025
Sold by
Chacon Maria
Bought by
Maria Chacon Living Trust and Chacon
Current Estimated Value
Purchase Details
Closed on
Nov 20, 2006
Sold by
Luna Alfonso and Luna Frances
Bought by
Garza Misael and Garza Adelfa
Home Financials for this Owner
Home Financials are based on the most recent Mortgage that was taken out on this home.
Original Mortgage
$36,400
Interest Rate
6.37%
Mortgage Type
Purchase Money Mortgage
Purchase Details
Closed on
Nov 17, 2006
Sold by
Salinas Frank and Salinas Juanita
Bought by
Chacon Maria
Home Financials for this Owner
Home Financials are based on the most recent Mortgage that was taken out on this home.
Original Mortgage
$36,400
Interest Rate
6.37%
Mortgage Type
Purchase Money Mortgage
Create a Home Valuation Report for This Property
The Home Valuation Report is an in-depth analysis detailing your home's value as well as a comparison with similar homes in the area
Home Values in the Area
Average Home Value in this Area
Purchase History
| Date | Buyer | Sale Price | Title Company |
|---|---|---|---|
| Maria Chacon Living Trust | -- | None Listed On Document | |
| Garza Misael | -- | Universal Land Title | |
| Chacon Maria | -- | First American Title |
Source: Public Records
Mortgage History
| Date | Status | Borrower | Loan Amount |
|---|---|---|---|
| Previous Owner | Chacon Maria | $36,400 |
Source: Public Records
Tax History Compared to Growth
Tax History
| Year | Tax Paid | Tax Assessment Tax Assessment Total Assessment is a certain percentage of the fair market value that is determined by local assessors to be the total taxable value of land and additions on the property. | Land | Improvement |
|---|---|---|---|---|
| 2025 | $2,409 | $119,700 | $49,475 | $70,225 |
| 2024 | $2,409 | $127,553 | $49,475 | $78,078 |
| 2023 | $2,124 | $110,000 | $38,240 | $71,760 |
| 2022 | $2,347 | $114,570 | $38,240 | $76,330 |
| 2021 | $1,914 | $92,260 | $35,060 | $57,200 |
| 2020 | $1,685 | $334,140 | $34,560 | $299,580 |
| 2019 | $1,677 | $73,410 | $21,270 | $52,140 |
| 2018 | $1,553 | $66,900 | $21,270 | $45,630 |
| 2017 | $1,417 | $60,730 | $21,270 | $39,460 |
| 2016 | $1,378 | $59,060 | $21,270 | $37,790 |
| 2015 | $1,363 | $58,090 | $21,270 | $36,820 |
| 2014 | $1,304 | $54,920 | $21,270 | $33,650 |
Source: Public Records
Map
Nearby Homes
- 1030 4th St
- 2513 3rd St
- 1401 5th St
- 1314 2nd St
- 1517 4th St
- 1314 1st St
- 905 5th St
- 901 5th St
- 1410 8th St
- 2409 Avenue K
- 2606 Wastelbread Ln
- 2523 Good Morrow Dr
- 2527 Good Morrow Dr
- 2622 Good Morrow Dr
- 2507 Good Morrow Dr
- 2614 Good Morrow Dr
- 1418 Carlisle St
- 2618 Wastelbread Ln
- 2519 Good Morrow Dr
- 5534 Handlewood Ln