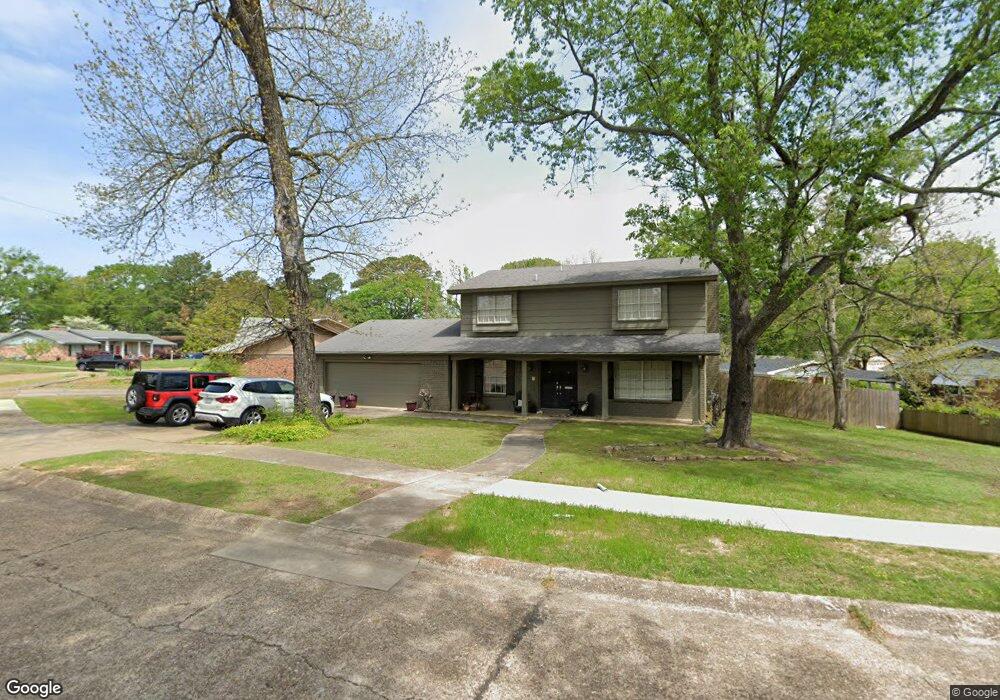
1310 Canadian St Texarkana, TX 75503
Estimated Value: $217,658 - $257,000
--
Bed
--
Bath
2,112
Sq Ft
$111/Sq Ft
Est. Value
About This Home
This home is located at 1310 Canadian St, Texarkana, TX 75503 and is currently estimated at $235,165, approximately $111 per square foot. 1310 Canadian St is a home located in Bowie County with nearby schools including Spring Lake Park Elementary School, Texas Middle School, and Texas High School.
Ownership History
Date
Name
Owned For
Owner Type
Purchase Details
Closed on
Nov 3, 2020
Sold by
Steitler Perry
Bought by
Steitler Julie A
Current Estimated Value
Purchase Details
Closed on
Jul 29, 2010
Sold by
Graves Matthew D and Graves Corey R
Bought by
Turner Julie A
Home Financials for this Owner
Home Financials are based on the most recent Mortgage that was taken out on this home.
Original Mortgage
$130,368
Outstanding Balance
$89,941
Interest Rate
5.5%
Mortgage Type
FHA
Estimated Equity
$145,224
Purchase Details
Closed on
Apr 4, 2008
Sold by
Williams Johnny and Williams Karol J
Bought by
Graves Matthew D and Graves Corey R
Home Financials for this Owner
Home Financials are based on the most recent Mortgage that was taken out on this home.
Original Mortgage
$125,800
Interest Rate
6.11%
Mortgage Type
Future Advance Clause Open End Mortgage
Create a Home Valuation Report for This Property
The Home Valuation Report is an in-depth analysis detailing your home's value as well as a comparison with similar homes in the area
Home Values in the Area
Average Home Value in this Area
Purchase History
| Date | Buyer | Sale Price | Title Company |
|---|---|---|---|
| Steitler Julie A | -- | Southwest Title Company | |
| Turner Julie A | -- | None Available | |
| Graves Matthew D | -- | None Available |
Source: Public Records
Mortgage History
| Date | Status | Borrower | Loan Amount |
|---|---|---|---|
| Open | Turner Julie A | $130,368 | |
| Previous Owner | Graves Matthew D | $125,800 |
Source: Public Records
Tax History Compared to Growth
Tax History
| Year | Tax Paid | Tax Assessment Tax Assessment Total Assessment is a certain percentage of the fair market value that is determined by local assessors to be the total taxable value of land and additions on the property. | Land | Improvement |
|---|---|---|---|---|
| 2025 | $3,658 | $222,071 | $20,000 | $202,071 |
| 2024 | $3,658 | $212,724 | $20,000 | $192,724 |
| 2023 | $4,554 | $192,319 | $20,000 | $172,319 |
| 2022 | $4,054 | $169,827 | $15,000 | $154,827 |
| 2021 | $3,701 | $144,715 | $15,000 | $129,715 |
| 2020 | $3,662 | $142,455 | $15,000 | $127,455 |
| 2019 | $3,647 | $136,727 | $15,000 | $121,727 |
| 2018 | $3,530 | $132,327 | $15,000 | $117,327 |
| 2017 | $3,438 | $129,261 | $15,000 | $114,261 |
| 2016 | $3,301 | $124,114 | $15,000 | $109,114 |
| 2015 | $3,159 | $123,124 | $15,000 | $108,124 |
| 2014 | $3,159 | $122,118 | $15,000 | $107,118 |
Source: Public Records
Map
Nearby Homes
- 1303 Holloway Dr
- 3507 Sabine Ave
- 3915 Sabine Ave
- 4101 Columbia Ave
- 139 Park Cir
- 24 Desoto Cir
- 4021 Pecos St
- 3319 Rhozine Ln
- 47 Desoto Cir
- 1300 Brazos St
- 2 Evergreen Dr
- 32 Park Ln
- 4418 Summerhill Rd
- 8 Lambeth Cir
- 4024 Main St
- 3402 Pine Knoll Rd
- 1 Lambeth Cir
- 3003 Anthony Dr
- 1800 Goree St
- 701 W 39th St
- 1312 Canadian St
- 1307 Colorado St
- 1309 Canadian St
- 1314 Canadian St
- 3711 Potomac Ave
- 1311 Canadian St
- 1315 Canadian St
- 3627 Potomac Ave
- 1317 Canadian St
- 3708 Potomac Ave
- 1212 Canadian St
- 1310 Holloway Dr
- 3801 Potomac Ave
- 1314 Holloway Dr
- 3802 Canadian St
- 1316 Holloway Dr
- 3603 Potomac Ave
- 1211 Canadian St
- 3802 Potomac Ave
- 1215 Colorado St