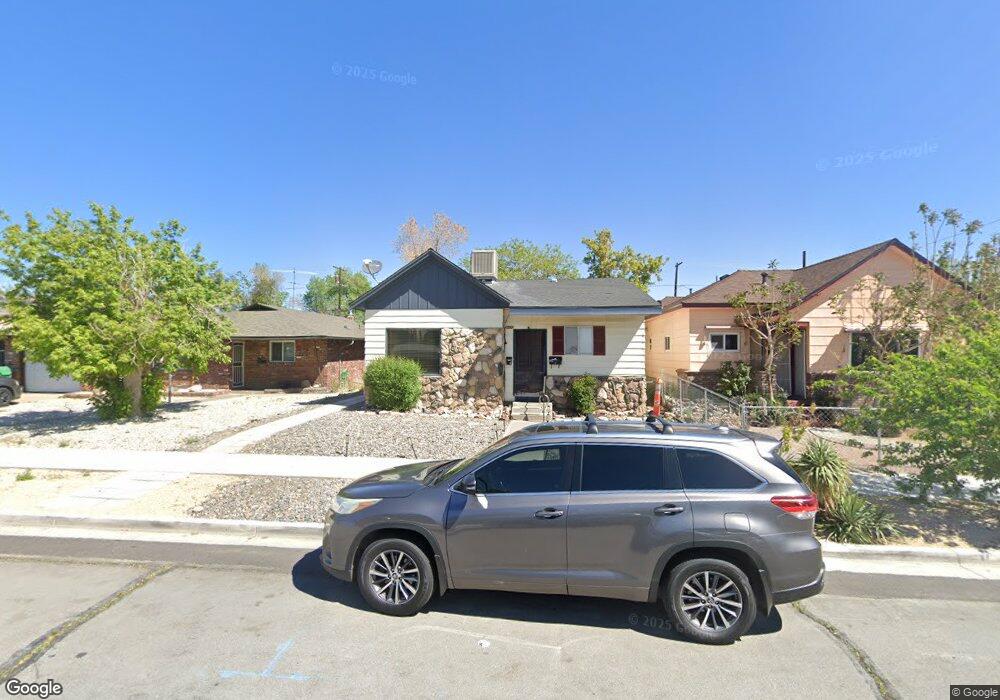
1310 E St Unit back house Sparks, NV 89431
Downtown Sparks NeighborhoodEstimated Value: $335,244 - $418,000
1
Bed
1
Bath
1,211
Sq Ft
$322/Sq Ft
Est. Value
About This Home
This home is located at 1310 E St Unit back house, Sparks, NV 89431 and is currently estimated at $390,311, approximately $322 per square foot. 1310 E St Unit back house is a home located in Washoe County with nearby schools including Robert Mitchell Elementary School, Sparks Middle School, and Sparks High School.
Ownership History
Date
Name
Owned For
Owner Type
Purchase Details
Closed on
Nov 4, 2002
Sold by
Clark Ross A and Clark Donna P
Bought by
Clark Ross A and Clark Donna P
Current Estimated Value
Home Financials for this Owner
Home Financials are based on the most recent Mortgage that was taken out on this home.
Original Mortgage
$81,429
Interest Rate
5.99%
Purchase Details
Closed on
Oct 5, 1998
Sold by
Clark Ross A and Clark Donna P
Bought by
Clark Ross A and Clark Donna P
Purchase Details
Closed on
Jun 21, 1996
Sold by
Holsclaw James M and Holsclaw Paulette B
Bought by
Clark Ross A and Clark Donna P
Home Financials for this Owner
Home Financials are based on the most recent Mortgage that was taken out on this home.
Original Mortgage
$87,984
Interest Rate
8.09%
Create a Home Valuation Report for This Property
The Home Valuation Report is an in-depth analysis detailing your home's value as well as a comparison with similar homes in the area
Home Values in the Area
Average Home Value in this Area
Purchase History
| Date | Buyer | Sale Price | Title Company |
|---|---|---|---|
| Clark Ross A | -- | -- | |
| Clark Ross A | -- | Stewart Title Northern Nevad | |
| Clark Ross A | -- | -- | |
| Clark Ross A | $110,000 | First Centennial Title Co |
Source: Public Records
Mortgage History
| Date | Status | Borrower | Loan Amount |
|---|---|---|---|
| Closed | Clark Ross A | $81,429 | |
| Closed | Clark Ross A | $87,984 |
Source: Public Records
Tax History Compared to Growth
Tax History
| Year | Tax Paid | Tax Assessment Tax Assessment Total Assessment is a certain percentage of the fair market value that is determined by local assessors to be the total taxable value of land and additions on the property. | Land | Improvement |
|---|---|---|---|---|
| 2025 | $719 | $47,324 | $30,091 | $17,233 |
| 2024 | $667 | $43,446 | $26,467 | $16,979 |
| 2023 | $667 | $44,837 | $29,094 | $15,743 |
| 2022 | $647 | $34,340 | $21,546 | $12,794 |
| 2021 | $600 | $27,813 | $15,461 | $12,352 |
| 2020 | $584 | $27,293 | $15,029 | $12,264 |
| 2019 | $557 | $24,522 | $12,934 | $11,588 |
| 2018 | $532 | $20,844 | $9,709 | $11,135 |
| 2017 | $511 | $20,181 | $9,077 | $11,104 |
| 2016 | $494 | $18,178 | $7,049 | $11,129 |
| 2015 | $131 | $16,505 | $5,486 | $11,019 |
| 2014 | $479 | $14,017 | $3,624 | $10,393 |
| 2013 | -- | $12,723 | $2,594 | $10,129 |
Source: Public Records
Map
Nearby Homes