M
Landlord's Agent in 2019
Maya Roseman
AMS Realty Inc.


Estimated Value: $396,294
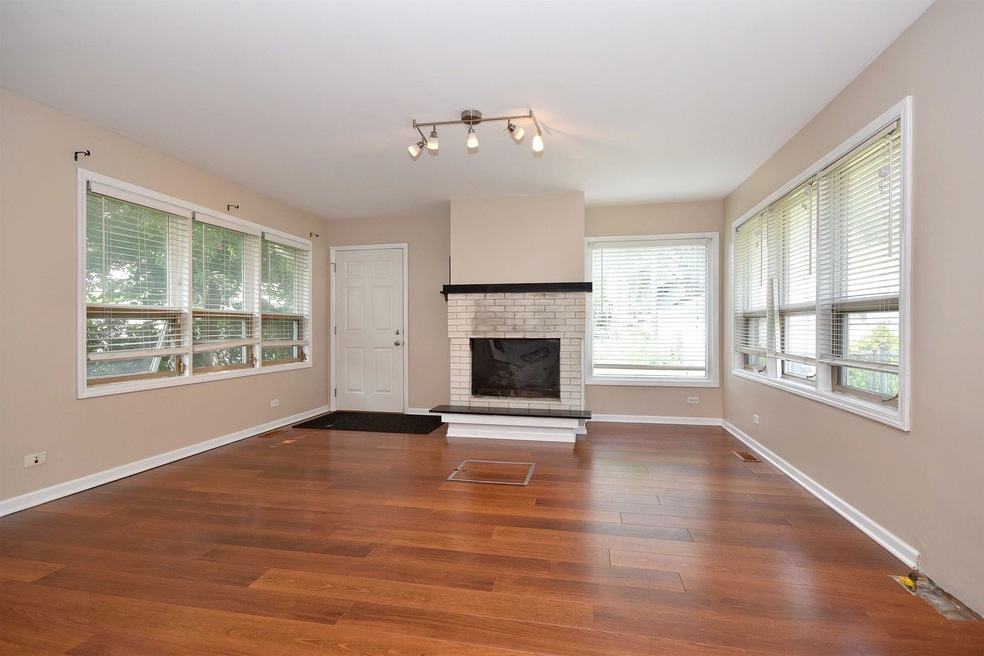
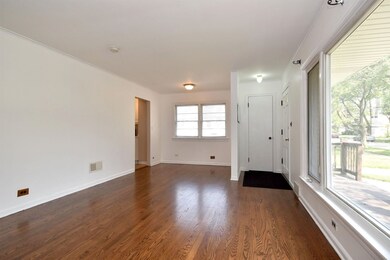
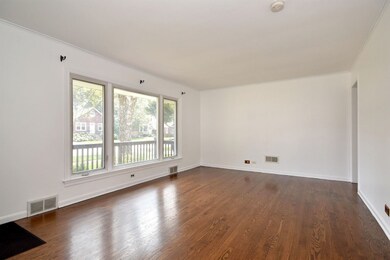
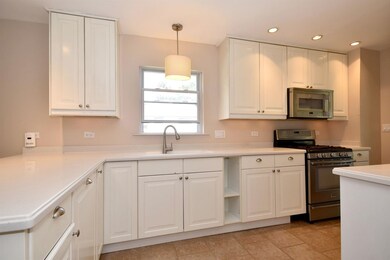
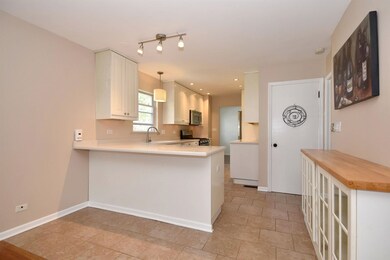
Great Downtown Des Plaines Brick 3 bedroom 1 1/2 bath ranch house with large fenced backyard and garage near shopping, restaurants, parks, Metra, expressway. Additional family room addition with fireplace! Full semi-finished basement and laundry room.
Last Agent to Rent the Property
Maya Roseman
AMS Realty Inc. License #475171976 Listed on: 07/27/2019
| Date | Event | Price | List to Sale | Price per Sq Ft |
|---|---|---|---|---|
| 08/15/2019 08/15/19 | Rented | $2,100 | 0.0% | -- |
| 07/27/2019 07/27/19 | For Rent | $2,100 | -- | -- |
| Year | Tax Paid | Tax Assessment Tax Assessment Total Assessment is a certain percentage of the fair market value that is determined by local assessors to be the total taxable value of land and additions on the property. | Land | Improvement |
|---|---|---|---|---|
| 2025 | $8,173 | $38,000 | $6,750 | $31,250 |
| 2024 | $8,173 | $31,000 | $6,000 | $25,000 |
| 2023 | $7,977 | $31,000 | $6,000 | $25,000 |
| 2022 | $7,977 | $31,000 | $6,000 | $25,000 |
| 2021 | $6,804 | $22,134 | $4,875 | $17,259 |
| 2020 | $6,689 | $22,134 | $4,875 | $17,259 |
| 2019 | $6,619 | $24,594 | $4,875 | $19,719 |
| 2018 | $7,112 | $23,781 | $4,312 | $19,469 |
| 2017 | $6,986 | $23,781 | $4,312 | $19,469 |
| 2016 | $6,608 | $23,781 | $4,312 | $19,469 |
| 2015 | $6,168 | $20,401 | $3,750 | $16,651 |
| 2014 | $6,038 | $20,401 | $3,750 | $16,651 |
| 2013 | $5,887 | $20,401 | $3,750 | $16,651 |
M
Landlord's Agent in 2019
Maya Roseman
AMS Realty Inc.

Tenant's Agent in 2019
Basel Tarabein
RE/MAX
(847) 828-2243
2 in this area
315 Total Sales
Source: Midwest Real Estate Data (MRED)
MLS Number: 10465853
APN: 09-20-211-027-0000
Disclaimer: Certain information contained herein is derived from information provided by parties other than Homes.com. All information provided is deemed reliable, but is not guaranteed to be accurate and should be independently verified.
![]() Based on information submitted to the MLS GRID. All data is obtained from various sources and may not have been verified by broker or MLS GRID. Supplied Open House Information is subject to change without notice. All information should be independently reviewed and verified for accuracy. Properties may or may not be listed by the office/agent presenting the information. Some IDX listings have been excluded from this website.
Based on information submitted to the MLS GRID. All data is obtained from various sources and may not have been verified by broker or MLS GRID. Supplied Open House Information is subject to change without notice. All information should be independently reviewed and verified for accuracy. Properties may or may not be listed by the office/agent presenting the information. Some IDX listings have been excluded from this website.
Based on information submitted to the MLS GRID
Ask me questions while you tour the home.