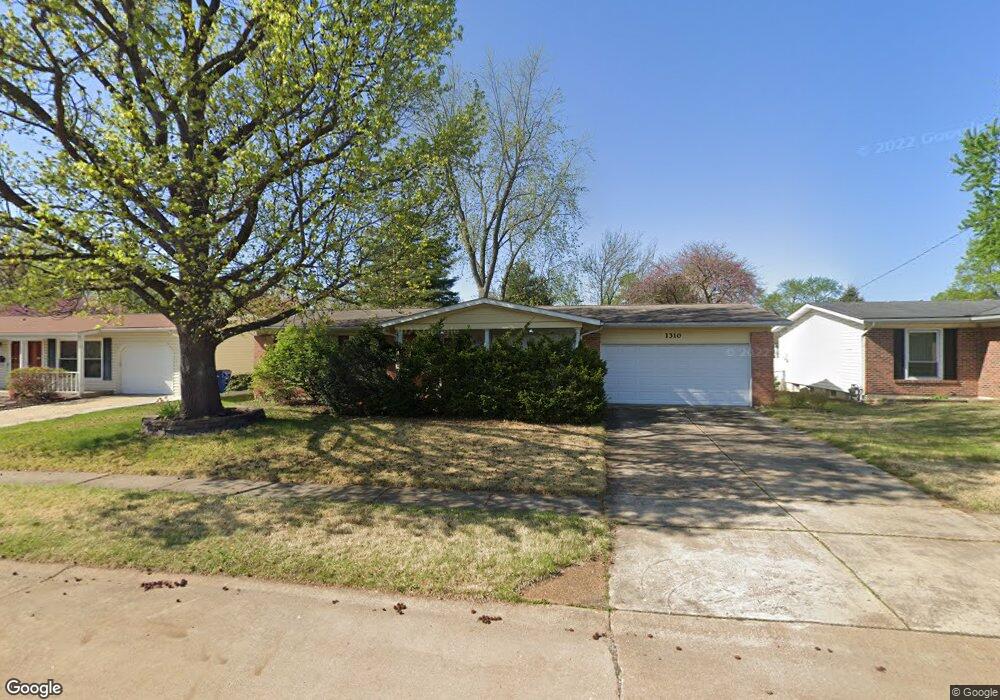
1310 Flamingo Dr Florissant, MO 63031
Estimated Value: $180,000 - $192,935
3
Beds
2
Baths
1,134
Sq Ft
$165/Sq Ft
Est. Value
About This Home
This home is located at 1310 Flamingo Dr, Florissant, MO 63031 and is currently estimated at $186,984, approximately $164 per square foot. 1310 Flamingo Dr is a home located in St. Louis County with nearby schools including Walker Elementary School, Northwest Middle School, and Hazelwood West High School.
Ownership History
Date
Name
Owned For
Owner Type
Purchase Details
Closed on
Jun 27, 2001
Sold by
Horan Timothy M
Bought by
Galer Heather M
Current Estimated Value
Home Financials for this Owner
Home Financials are based on the most recent Mortgage that was taken out on this home.
Original Mortgage
$85,848
Outstanding Balance
$32,534
Interest Rate
7.07%
Estimated Equity
$154,450
Purchase Details
Closed on
Jun 20, 2000
Sold by
Harms Dawn M
Bought by
Horan Timothy M and Galer Heather M
Home Financials for this Owner
Home Financials are based on the most recent Mortgage that was taken out on this home.
Original Mortgage
$86,969
Interest Rate
8.16%
Purchase Details
Closed on
Jun 30, 1999
Sold by
Ross Glenn R and Ross Jane L
Bought by
Galer Heather M and Harm Dawn M
Home Financials for this Owner
Home Financials are based on the most recent Mortgage that was taken out on this home.
Original Mortgage
$89,454
Interest Rate
7.21%
Mortgage Type
FHA
Create a Home Valuation Report for This Property
The Home Valuation Report is an in-depth analysis detailing your home's value as well as a comparison with similar homes in the area
Home Values in the Area
Average Home Value in this Area
Purchase History
| Date | Buyer | Sale Price | Title Company |
|---|---|---|---|
| Galer Heather M | -- | Land Title Company | |
| Horan Timothy M | -- | Land Title Company | |
| Galer Heather M | $89,500 | Land Title Company |
Source: Public Records
Mortgage History
| Date | Status | Borrower | Loan Amount |
|---|---|---|---|
| Open | Galer Heather M | $85,848 | |
| Previous Owner | Horan Timothy M | $86,969 | |
| Previous Owner | Galer Heather M | $89,454 |
Source: Public Records
Tax History Compared to Growth
Tax History
| Year | Tax Paid | Tax Assessment Tax Assessment Total Assessment is a certain percentage of the fair market value that is determined by local assessors to be the total taxable value of land and additions on the property. | Land | Improvement |
|---|---|---|---|---|
| 2025 | $2,513 | $34,130 | $5,740 | $28,390 |
| 2024 | $2,513 | $28,090 | $2,950 | $25,140 |
| 2023 | $2,510 | $28,090 | $2,950 | $25,140 |
| 2022 | $2,432 | $24,280 | $4,920 | $19,360 |
| 2021 | $2,368 | $24,280 | $4,920 | $19,360 |
| 2020 | $2,288 | $22,040 | $3,780 | $18,260 |
| 2019 | $2,254 | $22,040 | $3,780 | $18,260 |
| 2018 | $1,958 | $17,580 | $2,490 | $15,090 |
| 2017 | $1,956 | $17,580 | $2,490 | $15,090 |
| 2016 | $1,842 | $16,320 | $2,490 | $13,830 |
| 2015 | $1,803 | $16,320 | $2,490 | $13,830 |
| 2014 | $1,732 | $16,150 | $3,950 | $12,200 |
Source: Public Records
Map
Nearby Homes
- 1395 Bluebird Dr
- 1120 Bluebird Dr
- 1150 Verlene Dr
- 1155 Mullanphy Rd
- 1505 Swallow Ln
- 1415 Boulder Dr
- 915 Iris Dr
- 890 Tyson Dr
- 2186 Aristocrat Dr
- 6 Charlotte Dr
- 2255 Collier Dr
- 1825 Swallow Ln
- 2040 Splendor Dr
- 25 Hammes Dr
- 685 Mullanphy Rd
- 200 Francisca Dr
- 1075 Lees Ln
- 660 Crabapple Ln
- 1445 Vesper Dr
- 1920 Shackelford Rd
- 1280 Flamingo Dr
- 1330 Flamingo Dr
- 1275 Bluebird Dr
- 1285 Bluebird Dr
- 1255 Bluebird Dr
- 1340 Flamingo Dr
- 1270 Flamingo Dr
- 1285 Flamingo Dr
- 1315 Flamingo Dr
- 1275 Flamingo Dr
- 1295 Bluebird Dr
- 1335 Flamingo Dr
- 1235 Bluebird Dr
- 1350 Flamingo Dr
- 1250 Flamingo Dr
- 1245 Flamingo Dr
- 1345 Flamingo Dr
- 1270 Bluebird Dr
- 1280 Bluebird Dr
- 1230 Verlene Dr