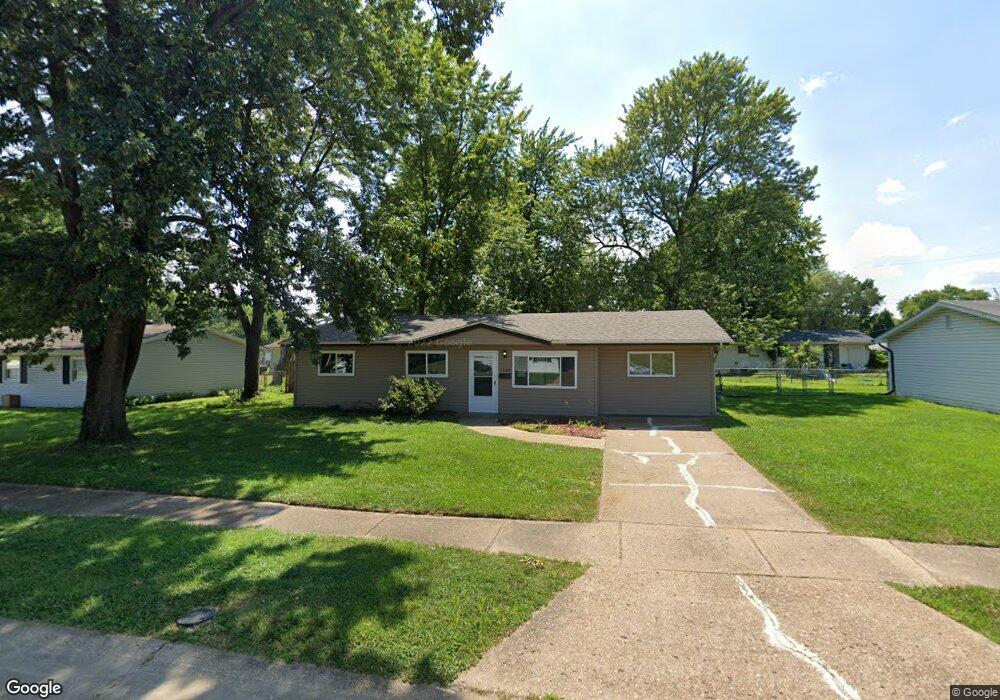
1310 Flicker Dr Florissant, MO 63031
Estimated Value: $154,000 - $168,000
3
Beds
2
Baths
1,320
Sq Ft
$122/Sq Ft
Est. Value
About This Home
This home is located at 1310 Flicker Dr, Florissant, MO 63031 and is currently estimated at $160,522, approximately $121 per square foot. 1310 Flicker Dr is a home located in St. Louis County with nearby schools including McCurdy Elementary School, Northwest Middle School, and Hazelwood West High School.
Ownership History
Date
Name
Owned For
Owner Type
Purchase Details
Closed on
Aug 20, 2020
Sold by
Galvin Eric and Porzelt Janet
Bought by
Growth Developments Llc
Current Estimated Value
Purchase Details
Closed on
Oct 30, 2007
Sold by
Babbitt Dennis and Weston Martha
Bought by
Galvin Eric and Porzelt Janet
Home Financials for this Owner
Home Financials are based on the most recent Mortgage that was taken out on this home.
Original Mortgage
$84,000
Interest Rate
6.42%
Mortgage Type
Purchase Money Mortgage
Purchase Details
Closed on
Nov 21, 2003
Sold by
Middlewest Properties Inc
Bought by
Babbitt Dennis and Weston Martha
Home Financials for this Owner
Home Financials are based on the most recent Mortgage that was taken out on this home.
Original Mortgage
$66,000
Interest Rate
4%
Mortgage Type
Purchase Money Mortgage
Purchase Details
Closed on
Sep 9, 2003
Sold by
S & P Properties Inc
Bought by
Middlewest Properties
Purchase Details
Closed on
Sep 3, 2003
Sold by
Sever James M and Sever Darla M
Bought by
S & P Properties Inc
Create a Home Valuation Report for This Property
The Home Valuation Report is an in-depth analysis detailing your home's value as well as a comparison with similar homes in the area
Home Values in the Area
Average Home Value in this Area
Purchase History
| Date | Buyer | Sale Price | Title Company |
|---|---|---|---|
| Growth Developments Llc | $75,000 | Integrity Title Sln Llc | |
| Vb One Llc | $93,500 | Total Title Services Llc | |
| Galvin Eric | $84,000 | Kts | |
| Babbitt Dennis | $82,500 | -- | |
| Middlewest Properties | $22,544 | -- | |
| S & P Properties Inc | $22,544 | -- |
Source: Public Records
Mortgage History
| Date | Status | Borrower | Loan Amount |
|---|---|---|---|
| Previous Owner | Galvin Eric | $84,000 | |
| Previous Owner | Babbitt Dennis | $66,000 |
Source: Public Records
Tax History Compared to Growth
Tax History
| Year | Tax Paid | Tax Assessment Tax Assessment Total Assessment is a certain percentage of the fair market value that is determined by local assessors to be the total taxable value of land and additions on the property. | Land | Improvement |
|---|---|---|---|---|
| 2025 | $2,069 | $30,440 | $4,640 | $25,800 |
| 2024 | $2,069 | $23,030 | $3,100 | $19,930 |
| 2023 | $2,066 | $23,030 | $3,100 | $19,930 |
| 2022 | $1,909 | $18,950 | $3,100 | $15,850 |
| 2021 | $1,859 | $18,950 | $3,100 | $15,850 |
| 2020 | $1,741 | $16,700 | $3,100 | $13,600 |
| 2019 | $1,714 | $16,700 | $3,100 | $13,600 |
| 2018 | $1,563 | $13,980 | $2,810 | $11,170 |
| 2017 | $1,561 | $13,980 | $2,810 | $11,170 |
| 2016 | $1,497 | $13,220 | $2,050 | $11,170 |
| 2015 | $1,466 | $13,220 | $2,050 | $11,170 |
| 2014 | $1,411 | $13,110 | $3,020 | $10,090 |
Source: Public Records
Map
Nearby Homes
- 1155 Mullanphy Rd
- 1395 Bluebird Dr
- 1415 Boulder Dr
- 1120 Bluebird Dr
- 1505 Swallow Ln
- 1150 Verlene Dr
- 890 Tyson Dr
- 6 Charlotte Dr
- 915 Iris Dr
- 1825 Swallow Ln
- 200 Francisca Dr
- 25 Hammes Dr
- 2186 Aristocrat Dr
- 2040 Splendor Dr
- 685 Mullanphy Rd
- 2255 Collier Dr
- 1270 Bobolink Dr
- 1445 Vesper Dr
- 8 Mcnulty Dr
- 1480 Vesper Dr
- 1330 Flicker Dr
- 1335 Mullanphy Rd
- 1295 Mullanphy Rd
- 1315 Flicker Dr
- 1350 Flicker Dr
- 1280 Flicker Dr
- 1335 Flicker Dr
- 1295 Flicker Dr
- 1355 Mullanphy Rd
- 1285 Mullanphy Rd
- 1355 Flicker Dr
- 1285 Flicker Dr
- 1370 Flicker Dr
- 1270 Flicker Dr
- 1375 Mullanphy Rd
- 1310 Swallow Ln
- 1275 Mullanphy Rd
- 1330 Swallow Ln
- 1290 Swallow Ln
- 1300 Mullanphy Rd