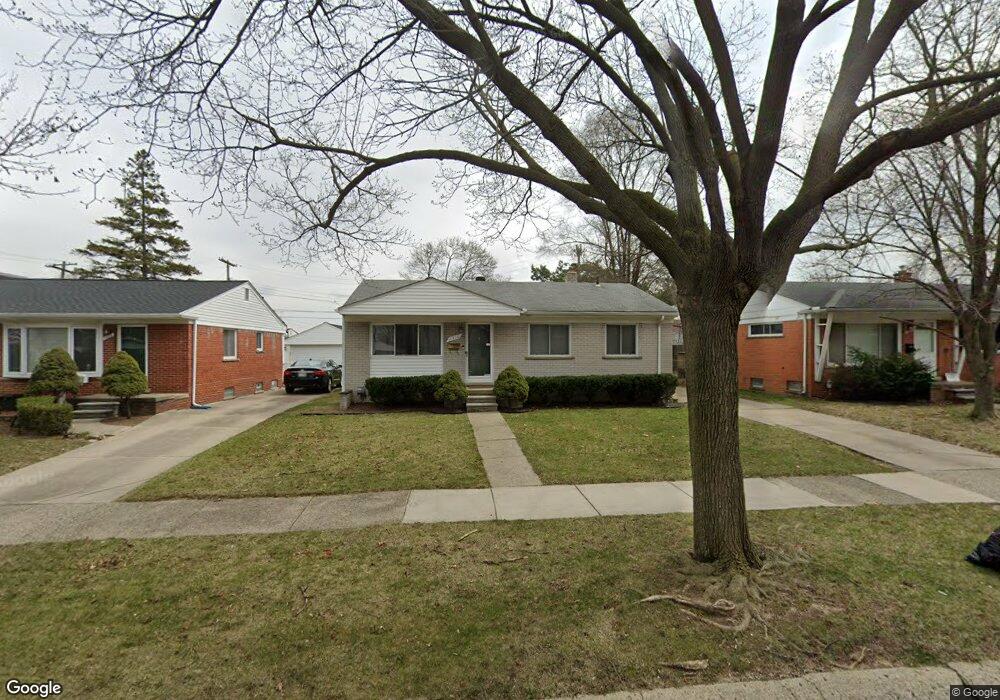
1310 Langley Blvd Clawson, MI 48017
Estimated Value: $291,000 - $300,000
3
Beds
1
Bath
1,080
Sq Ft
$274/Sq Ft
Est. Value
About This Home
This home is located at 1310 Langley Blvd, Clawson, MI 48017 and is currently estimated at $295,991, approximately $274 per square foot. 1310 Langley Blvd is a home located in Oakland County with nearby schools including Clawson Middle School, Clawson High School, and Japhet School.
Ownership History
Date
Name
Owned For
Owner Type
Purchase Details
Closed on
Mar 11, 2017
Sold by
Schroder Jennifer J
Bought by
Schroder Jennifer J and Schroder James M
Current Estimated Value
Home Financials for this Owner
Home Financials are based on the most recent Mortgage that was taken out on this home.
Original Mortgage
$142,373
Outstanding Balance
$119,110
Interest Rate
4.75%
Mortgage Type
FHA
Estimated Equity
$176,881
Purchase Details
Closed on
Mar 10, 2017
Sold by
Caron A Mclennan Trust
Bought by
Schroder Jennifer J
Home Financials for this Owner
Home Financials are based on the most recent Mortgage that was taken out on this home.
Original Mortgage
$142,373
Outstanding Balance
$119,110
Interest Rate
4.75%
Mortgage Type
FHA
Estimated Equity
$176,881
Purchase Details
Closed on
Oct 26, 2012
Sold by
Mclennan Caron A and Hall Caron A
Bought by
Hall Carol A and Caron A Mclennan Trust
Purchase Details
Closed on
Dec 3, 1998
Sold by
Rhodes Cecil
Bought by
Rhodes Cecil
Create a Home Valuation Report for This Property
The Home Valuation Report is an in-depth analysis detailing your home's value as well as a comparison with similar homes in the area
Home Values in the Area
Average Home Value in this Area
Purchase History
| Date | Buyer | Sale Price | Title Company |
|---|---|---|---|
| Schroder Jennifer J | -- | None Available | |
| Schroder Jennifer J | $145,000 | None Available | |
| Hall Carol A | -- | None Available | |
| Rhodes Cecil | -- | -- |
Source: Public Records
Mortgage History
| Date | Status | Borrower | Loan Amount |
|---|---|---|---|
| Open | Schroder Jennifer J | $142,373 |
Source: Public Records
Tax History
| Year | Tax Paid | Tax Assessment Tax Assessment Total Assessment is a certain percentage of the fair market value that is determined by local assessors to be the total taxable value of land and additions on the property. | Land | Improvement |
|---|---|---|---|---|
| 2025 | $4,621 | $128,180 | $0 | $0 |
| 2024 | $4,415 | $121,810 | $0 | $0 |
| 2023 | $4,233 | $110,350 | $0 | $0 |
| 2022 | $4,267 | $102,290 | $0 | $0 |
| 2021 | $4,179 | $95,850 | $0 | $0 |
| 2020 | $4,049 | $90,080 | $0 | $0 |
| 2019 | $4,184 | $85,950 | $0 | $0 |
| 2018 | $4,154 | $80,860 | $0 | $0 |
| 2017 | $2,754 | $78,160 | $0 | $0 |
| 2016 | $3,743 | $73,380 | $0 | $0 |
| 2015 | -- | $67,100 | $0 | $0 |
| 2014 | -- | $58,260 | $0 | $0 |
| 2011 | -- | $53,600 | $0 | $0 |
Source: Public Records
Map
Nearby Homes
- 1109 Kenilworth Place
- 930 Elmsford Dr
- 1087 N Stephen Ave
- 1451 Kenilworth Place
- 659 W Maple Rd
- 816 W Baker Ave
- 503 W Elmwood Ave
- 822 Phillips Ave
- 2130 Wickham St Unit 4
- 4905 Coventry St
- 5065 Crooks Rd Unit 49
- 124 Leroy Ave
- 114 Knollwood Blvd
- 609 John M Ave
- 4921 N Crooks Rd Unit N-10
- 4909 Crooks Rd Unit D6
- 4909 Crooks Rd Unit 4
- 57 W Elmwood Ave
- 4921 Crooks Rd Unit N 3
- 4921 Crooks Rd Unit M-10
- 1322 Langley Blvd
- 1304 Langley Blvd
- 1330 Langley Blvd
- 1205 Wright Dr
- 1239 Wright Dr
- 1260 Langley Blvd
- 1265 Wright Dr
- 1169 Wright Dr
- 1289 Wright Dr
- 1311 Langley Blvd
- 1303 Langley Blvd
- 1321 Langley Blvd
- 1089 School St
- 1067 School St
- 1109 Wright Dr
- 1331 Langley Blvd
- 1057 School St
- 1253 Langley Blvd
- 1341 Langley Blvd
- 1337 Wright Dr
Your Personal Tour Guide
Ask me questions while you tour the home.