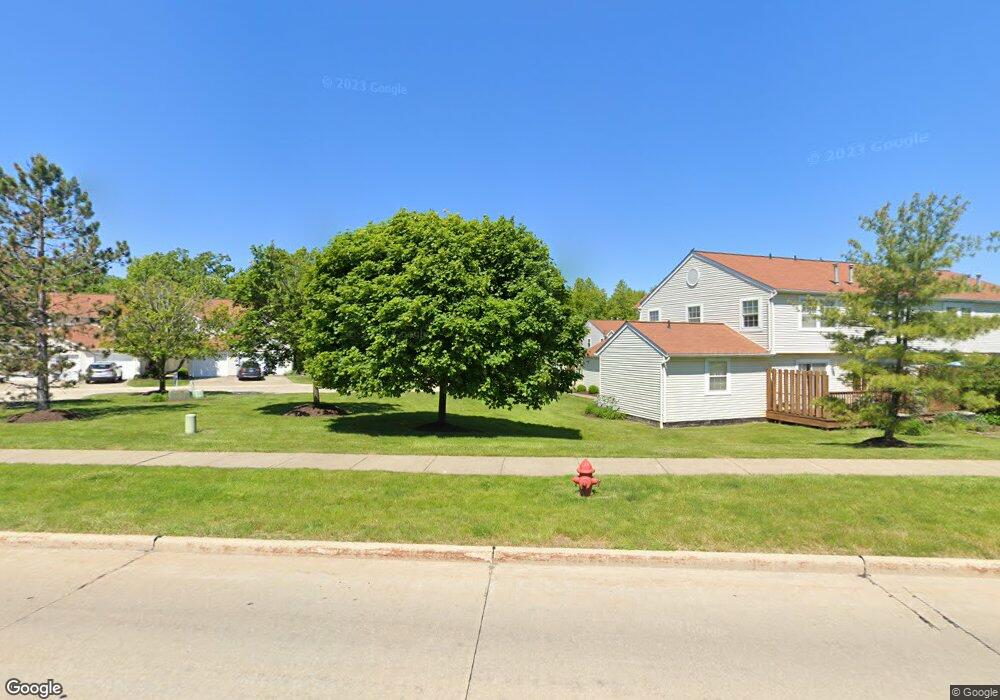
1310 Leeward Ln Unit D Willoughby, OH 44094
Estimated Value: $183,000 - $256,000
3
Beds
4
Baths
816
Sq Ft
$266/Sq Ft
Est. Value
About This Home
This home is located at 1310 Leeward Ln Unit D, Willoughby, OH 44094 and is currently estimated at $216,650, approximately $265 per square foot. 1310 Leeward Ln Unit D is a home located in Lake County with nearby schools including Grant Elementary School, Willoughby Middle School, and South High School.
Ownership History
Date
Name
Owned For
Owner Type
Purchase Details
Closed on
Jun 3, 2010
Sold by
Syslo Jeffrey C and Sureau Sophie
Bought by
Wong Stanley K and Loo Zoe S
Current Estimated Value
Purchase Details
Closed on
May 31, 2006
Sold by
Trivisonno Michael A and Trivisonno Kelly A
Bought by
Syslo Jeffrey C and Sureau Sophie
Home Financials for this Owner
Home Financials are based on the most recent Mortgage that was taken out on this home.
Original Mortgage
$146,000
Outstanding Balance
$84,241
Interest Rate
6.24%
Mortgage Type
Unknown
Estimated Equity
$132,409
Purchase Details
Closed on
May 6, 1997
Sold by
Enberg Gary L and Enberg Elizabeth
Bought by
Trivisonno Michael A
Home Financials for this Owner
Home Financials are based on the most recent Mortgage that was taken out on this home.
Original Mortgage
$103,800
Interest Rate
8%
Mortgage Type
Balloon
Purchase Details
Closed on
Mar 15, 1994
Bought by
Enberg Gary L
Create a Home Valuation Report for This Property
The Home Valuation Report is an in-depth analysis detailing your home's value as well as a comparison with similar homes in the area
Home Values in the Area
Average Home Value in this Area
Purchase History
| Date | Buyer | Sale Price | Title Company |
|---|---|---|---|
| Wong Stanley K | $153,000 | Progressive Land Title | |
| Syslo Jeffrey C | $162,500 | Equity Title Agency Inc | |
| Trivisonno Michael A | $129,800 | -- | |
| Enberg Gary L | $120,900 | -- |
Source: Public Records
Mortgage History
| Date | Status | Borrower | Loan Amount |
|---|---|---|---|
| Open | Syslo Jeffrey C | $146,000 | |
| Previous Owner | Trivisonno Michael A | $103,800 |
Source: Public Records
Tax History Compared to Growth
Tax History
| Year | Tax Paid | Tax Assessment Tax Assessment Total Assessment is a certain percentage of the fair market value that is determined by local assessors to be the total taxable value of land and additions on the property. | Land | Improvement |
|---|---|---|---|---|
| 2024 | -- | $59,770 | $16,880 | $42,890 |
| 2023 | $4,760 | $50,280 | $13,490 | $36,790 |
| 2022 | $3,099 | $50,280 | $13,490 | $36,790 |
| 2021 | $3,113 | $50,280 | $13,490 | $36,790 |
| 2020 | $3,036 | $43,720 | $11,730 | $31,990 |
| 2019 | $2,817 | $43,720 | $11,730 | $31,990 |
| 2018 | $2,784 | $48,280 | $7,700 | $40,580 |
| 2017 | $3,250 | $48,280 | $7,700 | $40,580 |
| 2016 | $3,239 | $48,280 | $7,700 | $40,580 |
| 2015 | $3,140 | $48,280 | $7,700 | $40,580 |
| 2014 | $2,980 | $48,280 | $7,700 | $40,580 |
| 2013 | $2,982 | $48,280 | $7,700 | $40,580 |
Source: Public Records
Map
Nearby Homes
- 1285 Leeward Ln Unit B
- 1245 Leeward Ln Unit A
- 0 V L Lake Shore Blvd Unit 5070796
- 37818 Lake Shore Blvd
- 1298 Beech St
- 37750 Willow Dr
- 38256 Lake Shore Blvd
- 1568 Westover Dr
- 1068 Elmwood Dr
- 211 Plymouth Rd
- 132 Shelton Blvd
- 967 Windermere Dr
- 38598 Granite Dr Unit 31
- 307 Shelton Blvd
- 38407 N Beachview Rd
- 284 E Overlook Dr
- 844 Peach Blvd
- 211 W Overlook Dr
- 856 Orchard Rd
- 36536 Lakehurst Dr
- 1350 Leeward Ln Unit D
- 1350 Leeward Ln Unit C
- 1350 Leeward Ln Unit B
- 1350 Leeward Ln Unit A
- 1310 Leeward Ln Unit C
- 1310 Leeward Ln Unit B
- 1310 Leeward Ln Unit A
- 1290 Leeward Ln Unit D
- 1290 Leeward Ln Unit C
- 1290 Leeward Ln Unit B
- 1290 Leeward Ln Unit A
- 1280 Leeward Ln Unit D
- 1280 Leeward Ln Unit C
- 1280 Leeward Ln Unit B
- 1280 Leeward Ln Unit A
- 1350 Leeward Ln Unit 15B
- 1290 Leeward Ln
- 1350 Leeward Ln
- 1350 Leeward Ln
- 1310 Leeward Ln