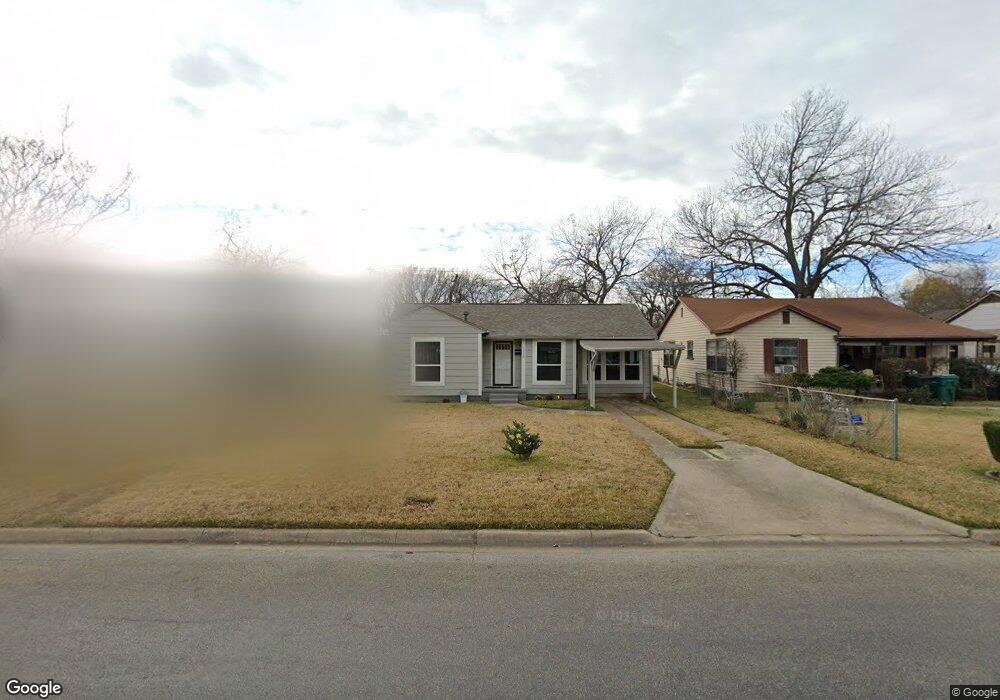
1310 N Ross Ave Sherman, TX 75090
Estimated Value: $159,902 - $171,000
--
Bed
1
Bath
1,106
Sq Ft
$150/Sq Ft
Est. Value
About This Home
This home is located at 1310 N Ross Ave, Sherman, TX 75090 and is currently estimated at $165,451, approximately $149 per square foot. 1310 N Ross Ave is a home located in Grayson County with nearby schools including Jefferson Elementary School, Piner Middle School, and Dillingham Intermediate School.
Ownership History
Date
Name
Owned For
Owner Type
Purchase Details
Closed on
Mar 16, 2022
Sold by
Lee Turner Jimmy
Bought by
Turner Bobby and Turner Joyce
Current Estimated Value
Home Financials for this Owner
Home Financials are based on the most recent Mortgage that was taken out on this home.
Original Mortgage
$115,762
Outstanding Balance
$108,073
Interest Rate
3.85%
Mortgage Type
Seller Take Back
Estimated Equity
$57,378
Purchase Details
Closed on
Mar 14, 2022
Sold by
Lee Turner Jimmy
Bought by
Turner Bobby and Turner Joyce
Home Financials for this Owner
Home Financials are based on the most recent Mortgage that was taken out on this home.
Original Mortgage
$115,762
Outstanding Balance
$108,073
Interest Rate
3.85%
Mortgage Type
Seller Take Back
Estimated Equity
$57,378
Create a Home Valuation Report for This Property
The Home Valuation Report is an in-depth analysis detailing your home's value as well as a comparison with similar homes in the area
Home Values in the Area
Average Home Value in this Area
Purchase History
| Date | Buyer | Sale Price | Title Company |
|---|---|---|---|
| Turner Bobby | -- | Red River Title | |
| Turner Bobby | -- | Red River Title |
Source: Public Records
Mortgage History
| Date | Status | Borrower | Loan Amount |
|---|---|---|---|
| Open | Turner Bobby | $115,762 | |
| Closed | Turner Bobby | $115,762 |
Source: Public Records
Tax History Compared to Growth
Tax History
| Year | Tax Paid | Tax Assessment Tax Assessment Total Assessment is a certain percentage of the fair market value that is determined by local assessors to be the total taxable value of land and additions on the property. | Land | Improvement |
|---|---|---|---|---|
| 2025 | $1,291 | $147,574 | $46,500 | $101,074 |
| 2024 | $3,451 | $157,321 | $45,000 | $112,321 |
| 2023 | $1,292 | $151,829 | $0 | $0 |
| 2022 | $3,235 | $138,026 | $20,250 | $117,776 |
| 2021 | $2,917 | $116,362 | $19,500 | $96,862 |
| 2020 | $1,547 | $58,945 | $12,825 | $46,120 |
| 2019 | $1,358 | $50,371 | $4,988 | $45,383 |
| 2018 | $1,235 | $49,244 | $3,300 | $45,944 |
| 2017 | $959 | $38,538 | $2,288 | $36,250 |
| 2016 | $919 | $36,907 | $2,288 | $34,619 |
| 2015 | $832 | $33,485 | $2,288 | $31,197 |
| 2014 | $668 | $26,885 | $2,288 | $24,597 |
Source: Public Records
Map
Nearby Homes
- 1110 N Ross Ave
- 13 E Lewis St
- 1 E Lewis St
- 5 E Lewis St
- 14 E Lewis St
- 1416 N Cleveland Ave
- 1511 N Brents Ave
- 1215 N Grand Ave
- 1007 N Cleveland Ave
- 1721 N Hoard Ave
- 2233 E Tuck St
- 1915 E Cole Ave
- TBD N Cleveland Ave
- 716 N Harrison Ave
- 703 N Cleveland Ave
- 2239 E Tuck St
- 1705 E Hilton St
- 417 N Burdette Ave
- 508 N Elliott St
- 406 N Burdette Ave
- 1304 N Ross Ave
- 1314 N Ross Ave
- 1302 N Ross Ave
- 1318 N Ross Ave
- 1322 N Ross Ave
- 1305 N Harrison Ave
- 1301 N Harrison Ave
- 1317 N Harrison Ave
- 1309 N Harrison Ave
- 1329 N Harrison Ave
- 1313 N Ross Ave
- 1303 N Ross Ave
- 1315 N Ross Ave
- 1220 N Ross Ave
- 1402 N Ross Ave
- 1215 N Harrison Ave
- 1321 N Ross Ave
- 1223 N Ross Ave
- 1206 N Ross Ave
- 1215 N Ross Ave