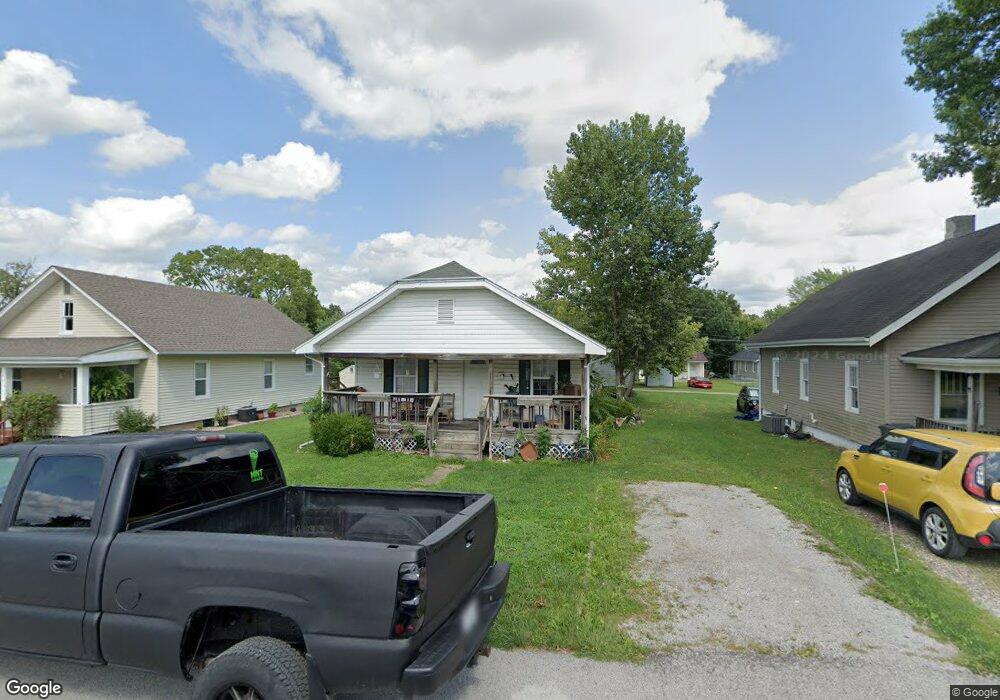
1310 Ruby Ave Hannibal, MO 63401
Estimated Value: $123,000 - $161,000
2
Beds
1
Bath
845
Sq Ft
$168/Sq Ft
Est. Value
About This Home
This home is located at 1310 Ruby Ave, Hannibal, MO 63401 and is currently estimated at $142,169, approximately $168 per square foot. 1310 Ruby Ave is a home located in Marion County with nearby schools including Hannibal Senior High School, St. John's Lutheran School, and Holy Family School.
Ownership History
Date
Name
Owned For
Owner Type
Purchase Details
Closed on
Oct 7, 2011
Sold by
Creech Joshua R and Creech Lea N
Bought by
Darr Jay D
Current Estimated Value
Home Financials for this Owner
Home Financials are based on the most recent Mortgage that was taken out on this home.
Original Mortgage
$65,900
Outstanding Balance
$46,765
Interest Rate
3.87%
Mortgage Type
USDA
Estimated Equity
$95,404
Purchase Details
Closed on
Jul 14, 2006
Sold by
Delaporte Richard W and Delaporte Jewel I
Bought by
Creech Joshua R and Todd Lea N
Home Financials for this Owner
Home Financials are based on the most recent Mortgage that was taken out on this home.
Original Mortgage
$48,450
Interest Rate
6.67%
Mortgage Type
New Conventional
Purchase Details
Closed on
Apr 13, 2006
Sold by
Pemberton Brad and Pemberton Tarasa
Bought by
Delaporte Richard W and Delaporte Jewel I
Create a Home Valuation Report for This Property
The Home Valuation Report is an in-depth analysis detailing your home's value as well as a comparison with similar homes in the area
Home Values in the Area
Average Home Value in this Area
Purchase History
| Date | Buyer | Sale Price | Title Company |
|---|---|---|---|
| Darr Jay D | -- | None Available | |
| Creech Joshua R | -- | None Available | |
| Delaporte Richard W | -- | None Available |
Source: Public Records
Mortgage History
| Date | Status | Borrower | Loan Amount |
|---|---|---|---|
| Open | Darr Jay D | $65,900 | |
| Previous Owner | Creech Joshua R | $48,450 |
Source: Public Records
Tax History
| Year | Tax Paid | Tax Assessment Tax Assessment Total Assessment is a certain percentage of the fair market value that is determined by local assessors to be the total taxable value of land and additions on the property. | Land | Improvement |
|---|---|---|---|---|
| 2025 | $623 | $9,620 | $510 | $9,110 |
| 2024 | $583 | $8,740 | $460 | $8,280 |
| 2023 | $546 | $8,740 | $460 | $8,280 |
| 2022 | $545 | $8,740 | $460 | $8,280 |
| 2021 | $541 | $8,740 | $460 | $8,280 |
| 2020 | $504 | $7,940 | $420 | $7,520 |
| 2019 | $503 | $7,940 | $420 | $7,520 |
| 2018 | $502 | $7,940 | $420 | $7,520 |
| 2017 | $490 | $7,940 | $420 | $7,520 |
| 2015 | $418 | $7,940 | $420 | $7,520 |
| 2014 | $418 | $7,940 | $420 | $7,520 |
| 2012 | -- | $7,940 | $0 | $0 |
Source: Public Records
Map
Nearby Homes
Your Personal Tour Guide
Ask me questions while you tour the home.