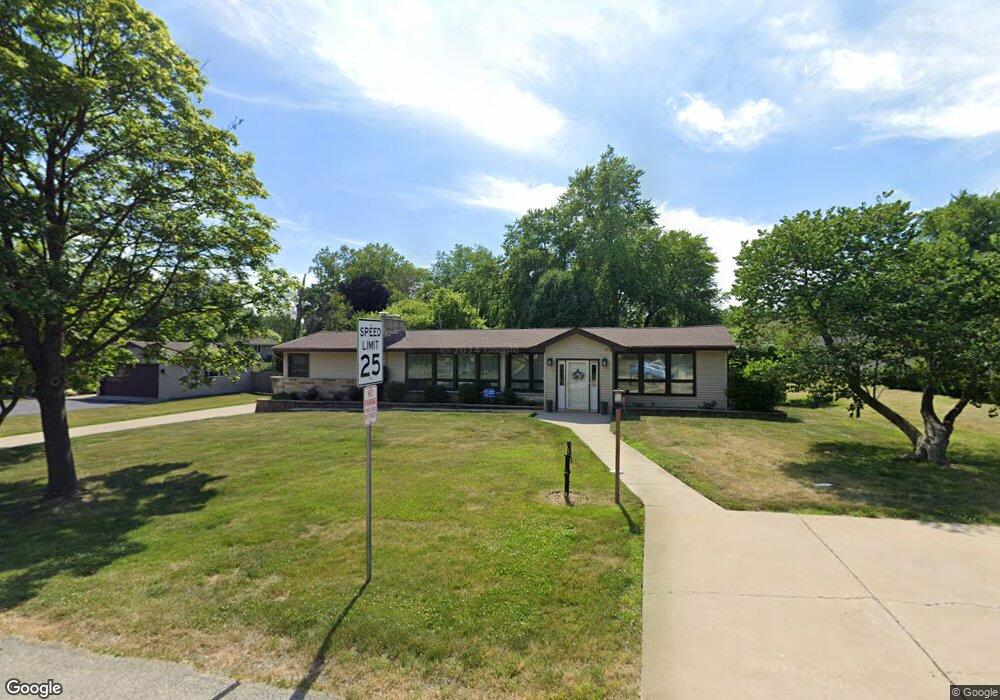
1310 S Oakland Ave Villa Park, IL 60181
Estimated Value: $369,000 - $431,000
--
Bed
--
Bath
1,196
Sq Ft
$338/Sq Ft
Est. Value
About This Home
This home is located at 1310 S Oakland Ave, Villa Park, IL 60181 and is currently estimated at $404,240, approximately $337 per square foot. 1310 S Oakland Ave is a home located in DuPage County with nearby schools including Salt Creek Elementary School, John E Albright Middle School, and Stella May Swartz Elementary School.
Ownership History
Date
Name
Owned For
Owner Type
Purchase Details
Closed on
Sep 15, 2020
Sold by
Dohe Rochelle F and Thomas A Dohe Living Trust
Bought by
Conroy Peter and Conroy Monica
Current Estimated Value
Home Financials for this Owner
Home Financials are based on the most recent Mortgage that was taken out on this home.
Original Mortgage
$330,000
Outstanding Balance
$292,691
Interest Rate
2.87%
Mortgage Type
New Conventional
Estimated Equity
$111,549
Purchase Details
Closed on
Aug 21, 2007
Sold by
Dohe Thomas A and Dohe Rochelle F
Bought by
Dohe Thomas A and Dohe Rochelle F
Purchase Details
Closed on
Oct 7, 2003
Sold by
Grieco Terran M
Bought by
Dohe Thomas and Dohe Rochelle
Purchase Details
Closed on
Aug 6, 1999
Sold by
King John T and King Elizabeth C
Bought by
Grieco Terran M
Home Financials for this Owner
Home Financials are based on the most recent Mortgage that was taken out on this home.
Original Mortgage
$168,000
Interest Rate
6.5%
Create a Home Valuation Report for This Property
The Home Valuation Report is an in-depth analysis detailing your home's value as well as a comparison with similar homes in the area
Home Values in the Area
Average Home Value in this Area
Purchase History
| Date | Buyer | Sale Price | Title Company |
|---|---|---|---|
| Conroy Peter | $350,000 | Attorney | |
| Dohe Thomas A | -- | None Available | |
| Dohe Thomas | $365,000 | Chicago Title Insurance Comp | |
| Grieco Terran M | $210,000 | Law Title Insurance Co Inc |
Source: Public Records
Mortgage History
| Date | Status | Borrower | Loan Amount |
|---|---|---|---|
| Open | Conroy Peter | $330,000 | |
| Previous Owner | Grieco Terran M | $168,000 |
Source: Public Records
Tax History Compared to Growth
Tax History
| Year | Tax Paid | Tax Assessment Tax Assessment Total Assessment is a certain percentage of the fair market value that is determined by local assessors to be the total taxable value of land and additions on the property. | Land | Improvement |
|---|---|---|---|---|
| 2024 | $5,888 | $108,735 | $49,128 | $59,607 |
| 2023 | $5,262 | $100,550 | $45,430 | $55,120 |
| 2022 | $5,110 | $96,660 | $43,670 | $52,990 |
| 2021 | $5,089 | $94,250 | $42,580 | $51,670 |
| 2020 | $4,981 | $92,190 | $41,650 | $50,540 |
| 2019 | $4,723 | $87,650 | $39,600 | $48,050 |
| 2018 | $4,651 | $82,150 | $37,120 | $45,030 |
| 2017 | $4,548 | $78,280 | $35,370 | $42,910 |
| 2016 | $4,193 | $73,740 | $33,320 | $40,420 |
| 2015 | $4,128 | $68,700 | $31,040 | $37,660 |
| 2014 | $4,605 | $75,170 | $36,790 | $38,380 |
| 2013 | $4,317 | $76,230 | $37,310 | $38,920 |
Source: Public Records
Map
Nearby Homes
- 0S639 Summit Ave
- 625 E Van Buren St
- 650 E Van Buren St
- 1046 E Van Buren St
- 2 Ardmore Ave
- 818 S Villa Ave
- 1500 S Ardmore Ave Unit 408
- 727 S Oakland Ave
- 1S325 Buttercup Ln
- 639 S Oakland Ave
- 1S134 Holyoke Ln Unit G
- 633 S Monterey Ave
- 1S122 Stratford Ln Unit 3
- 18W118 14th St Unit 4
- 1S265 Dillon Ln
- 4 Waldorf Ct
- 613 S Summit Ave
- 1S266 Dillon Ln
- 604 S Grant Ave
- 412 E Washington St
- 1300 S Oakland Ave
- 1320 S Oakland Ave
- 1315 S Villa Ave
- 1305 S Villa Ave
- 1325 S Villa Ave
- 1315 S Oakland Ave
- 1330 S Oakland Ave
- 1325 S Oakland Ave
- 475 E Kolberg Ct
- 1335 S Villa Ave
- 1335 S Oakland Ave
- 420 E Kolberg Ct
- 430 E Kolberg Ct
- 410 E Kolberg Ct
- 400 E Kolberg Ct
- 1340 S Oakland Ave
- 1345 S Villa Ave
- 1345 S Oakland Ave
- 1310 S Monterey Ave
- 505 E Kolberg Ct