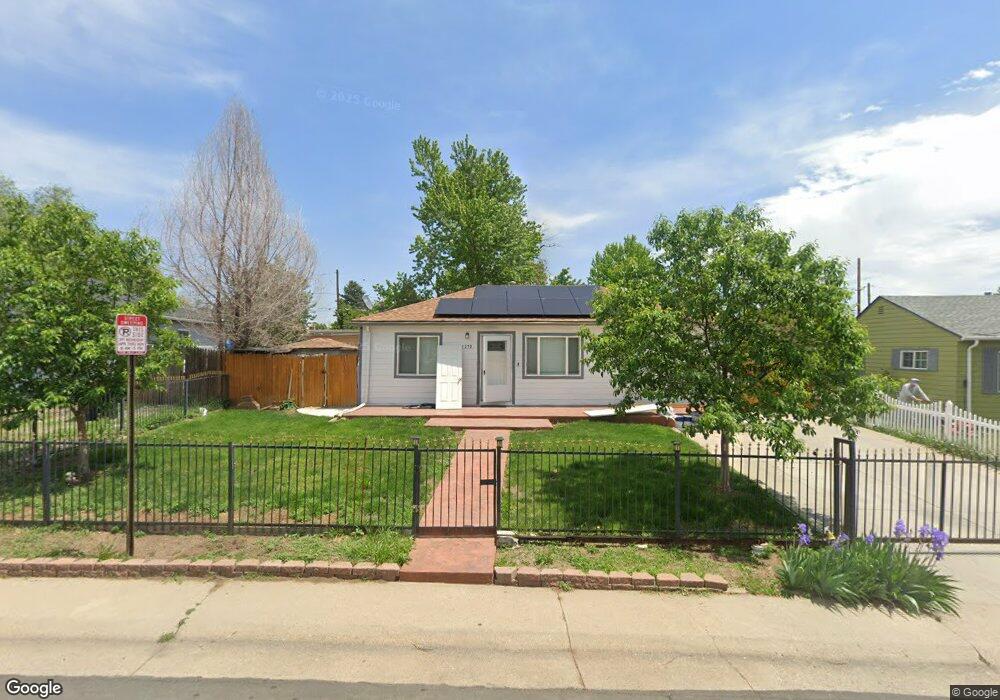
1310 S Winona Ct Denver, CO 80219
Mar Lee NeighborhoodEstimated Value: $413,558 - $456,000
3
Beds
1
Bath
1,257
Sq Ft
$347/Sq Ft
Est. Value
About This Home
This home is located at 1310 S Winona Ct, Denver, CO 80219 and is currently estimated at $435,640, approximately $346 per square foot. 1310 S Winona Ct is a home located in Denver County with nearby schools including Force Elementary School, Kepner Beacon Middle School, and John F Kennedy High School.
Ownership History
Date
Name
Owned For
Owner Type
Purchase Details
Closed on
Jun 1, 2022
Sold by
Robles Chairez Rogelio
Bought by
Hernandez Daniel and Robles Manuel Hernandez
Current Estimated Value
Purchase Details
Closed on
Nov 27, 2017
Sold by
Montoya Wayne A and Montoya Brenda R
Bought by
Charirez Rogelio Robles and Alva Daniel Hernandez
Home Financials for this Owner
Home Financials are based on the most recent Mortgage that was taken out on this home.
Original Mortgage
$257,427
Interest Rate
3.87%
Mortgage Type
FHA
Purchase Details
Closed on
Nov 28, 2001
Sold by
Schlenz Virginia A
Bought by
Montoya Wayne A and Montoya Brenda R
Home Financials for this Owner
Home Financials are based on the most recent Mortgage that was taken out on this home.
Original Mortgage
$152,341
Interest Rate
6.57%
Mortgage Type
FHA
Create a Home Valuation Report for This Property
The Home Valuation Report is an in-depth analysis detailing your home's value as well as a comparison with similar homes in the area
Home Values in the Area
Average Home Value in this Area
Purchase History
| Date | Buyer | Sale Price | Title Company |
|---|---|---|---|
| Hernandez Daniel | -- | None Listed On Document | |
| Charirez Rogelio Robles | $290,000 | Chicago Title | |
| Montoya Wayne A | $154,500 | First American Heritage Titl |
Source: Public Records
Mortgage History
| Date | Status | Borrower | Loan Amount |
|---|---|---|---|
| Previous Owner | Charirez Rogelio Robles | $257,427 | |
| Previous Owner | Montoya Wayne A | $152,341 | |
| Closed | Montoya Wayne A | $4,000 |
Source: Public Records
Tax History Compared to Growth
Tax History
| Year | Tax Paid | Tax Assessment Tax Assessment Total Assessment is a certain percentage of the fair market value that is determined by local assessors to be the total taxable value of land and additions on the property. | Land | Improvement |
|---|---|---|---|---|
| 2024 | $2,005 | $25,310 | $3,010 | $22,300 |
| 2023 | $1,961 | $25,310 | $3,010 | $22,300 |
| 2022 | $1,730 | $21,760 | $6,940 | $14,820 |
| 2021 | $1,730 | $22,390 | $7,140 | $15,250 |
| 2020 | $1,532 | $20,650 | $7,140 | $13,510 |
| 2019 | $1,489 | $20,650 | $7,140 | $13,510 |
| 2018 | $1,222 | $15,790 | $5,390 | $10,400 |
| 2017 | $1,218 | $15,790 | $5,390 | $10,400 |
| 2016 | $895 | $10,970 | $5,628 | $5,342 |
| 2015 | $857 | $10,970 | $5,628 | $5,342 |
| 2014 | $636 | $7,660 | $3,311 | $4,349 |
Source: Public Records
Map
Nearby Homes
- 1470 S Winona Way
- 1455 S Tennyson St
- 1135 S Vrain St
- 1493 S Yates St
- 1361 S Perry St
- 1141 S Zenobia St
- 1381 S Perry St
- 4445 W Tennessee Ave
- 1075 S Raleigh St
- 1470 S Quitman St
- 1110 S Quitman St
- 971 S Wolff St
- 1255 S Patton Ct
- 1646 S Winona Ct
- 1532 S Quitman St
- 1124 S Perry St
- 1200 S Patton Ct
- 1600 S Sheridan Blvd
- 1050 S Quitman St
- 1235 S Benton St
- 1320 S Winona Ct
- 1300 S Winona Ct
- 1330 S Winona Ct
- 1315 S Winona Ct
- 1305 S Winona Ct
- 4635 W Wyoming Place
- 1325 S Winona Ct
- 1290 S Winona Ct
- 1315 S Vrain St
- 1305 S Vrain St
- 1335 S Vrain St
- 1345 S Vrain St
- 1295 S Winona Ct
- 4735 W Wyoming Place
- 1288 S Winona Ct
- 4670 W Wyoming Place
- 1295 S Vrain St
- 1285 S Winona Ct
- 4690 W Wyoming Place
- 4650 W Wyoming Place