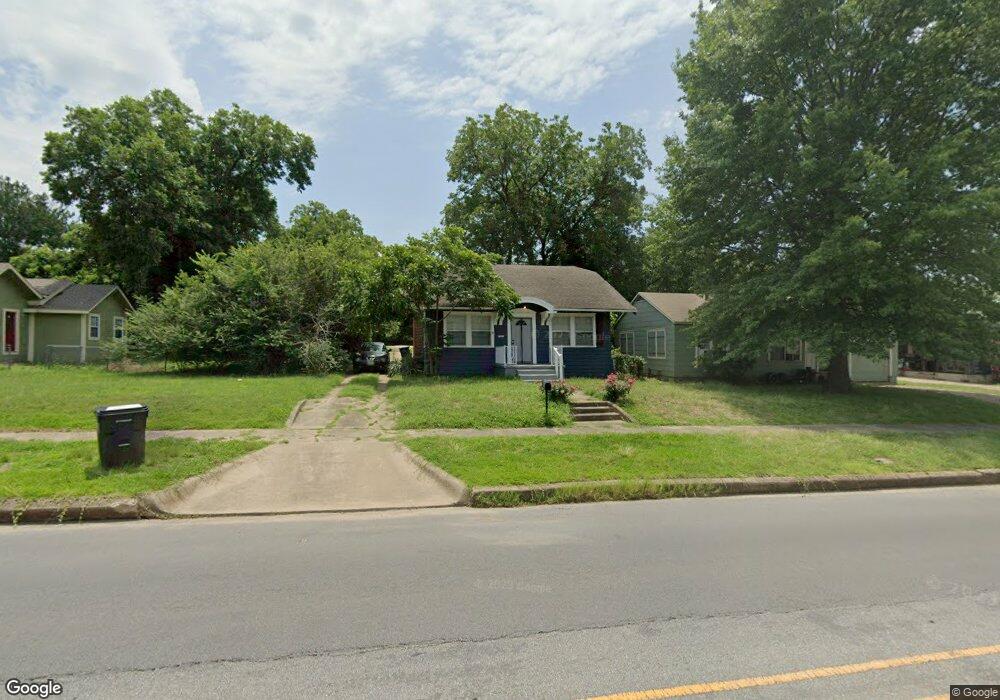
1310 W Morton St Denison, TX 75020
Estimated Value: $169,379 - $173,000
3
Beds
2
Baths
1,400
Sq Ft
$122/Sq Ft
Est. Value
About This Home
This home is located at 1310 W Morton St, Denison, TX 75020 and is currently estimated at $171,190, approximately $122 per square foot. 1310 W Morton St is a home located in Grayson County with nearby schools including Terrell Elementary School, Scott Middle School, and Denison High School.
Ownership History
Date
Name
Owned For
Owner Type
Purchase Details
Closed on
May 1, 2018
Bought by
Edstrom Michael E
Current Estimated Value
Home Financials for this Owner
Home Financials are based on the most recent Mortgage that was taken out on this home.
Original Mortgage
$69,200
Outstanding Balance
$59,829
Interest Rate
4.58%
Estimated Equity
$111,361
Purchase Details
Closed on
Jul 26, 2016
Sold by
Carrington Mortgage Services Llc
Bought by
Secretary Of Housing & Urban Development
Purchase Details
Closed on
May 9, 2016
Sold by
Paciera Philip and Paciera Autumn
Bought by
Carrington Mortgage Services Llc
Purchase Details
Closed on
Dec 18, 2006
Sold by
Vickrey Roy L and Vickrey Kathy J
Bought by
Paciera Philip
Home Financials for this Owner
Home Financials are based on the most recent Mortgage that was taken out on this home.
Original Mortgage
$54,370
Interest Rate
6.3%
Mortgage Type
Purchase Money Mortgage
Create a Home Valuation Report for This Property
The Home Valuation Report is an in-depth analysis detailing your home's value as well as a comparison with similar homes in the area
Home Values in the Area
Average Home Value in this Area
Purchase History
| Date | Buyer | Sale Price | Title Company |
|---|---|---|---|
| Edstrom Michael E | -- | -- | |
| Secretary Of Housing & Urban Development | -- | None Available | |
| Carrington Mortgage Services Llc | $50,050 | None Available | |
| Paciera Philip | -- | Red River Title Co |
Source: Public Records
Mortgage History
| Date | Status | Borrower | Loan Amount |
|---|---|---|---|
| Open | Edstrom Michael E | $69,200 | |
| Closed | Edstrom Michael E | -- | |
| Previous Owner | Paciera Philip | $54,370 |
Source: Public Records
Tax History Compared to Growth
Tax History
| Year | Tax Paid | Tax Assessment Tax Assessment Total Assessment is a certain percentage of the fair market value that is determined by local assessors to be the total taxable value of land and additions on the property. | Land | Improvement |
|---|---|---|---|---|
| 2025 | $3,612 | $150,172 | $43,125 | $107,047 |
| 2024 | $3,612 | $155,481 | $47,250 | $108,231 |
| 2023 | $3,206 | $141,507 | $40,875 | $100,632 |
| 2022 | $3,096 | $130,292 | $40,875 | $89,417 |
| 2021 | $2,288 | $90,708 | $20,250 | $70,458 |
| 2020 | $2,450 | $92,885 | $15,000 | $77,885 |
| 2019 | $2,569 | $93,370 | $12,450 | $80,920 |
| 2018 | $1,785 | $64,349 | $7,800 | $56,549 |
| 2017 | $1,394 | $49,812 | $6,975 | $42,837 |
| 2016 | $1,504 | $53,775 | $4,200 | $49,575 |
| 2015 | $949 | $48,543 | $3,150 | $45,393 |
| 2014 | $1,039 | $46,337 | $3,150 | $43,187 |
Source: Public Records
Map
Nearby Homes
- 1309 W Morton St
- 1320 W Morton St
- 1208 W Sears St
- 1315 W Gandy St
- 1123 W Sears St
- 1111 W Sears St
- 1104 W Bond St
- 1114 W Walker St
- 1200 W Gandy St
- 3030 W Morton St
- 1700 W Morton St
- 3300 W Morton St
- 1209 W Johnson St
- 2900 W Morton St
- 3130 W Morton St
- 1601 W Bond St
- 1230 W Woodard St
- 1031 W Gandy St
- 1119 W Johnson St
- 1505 W Johnson St
- 1314 W Morton St
- 1300 W Morton St
- 1316 W Morton St
- 1327 W Morton St
- 1315 W Sears St
- 1301 W Sears St
- 1301 W Sears St
- 1317 W Sears St
- 1324 W Morton St
- 1309 W Sears St
- 1323 W Sears St
- 1305 W Morton St
- 1315 W Morton St
- 1230 W Morton St
- 1301 W Morton St
- 1317 W Morton St
- 1330 W Morton St
- 1330 W Morton St Unit 1
- 1329 W Sears St
- 1231 W Sears St