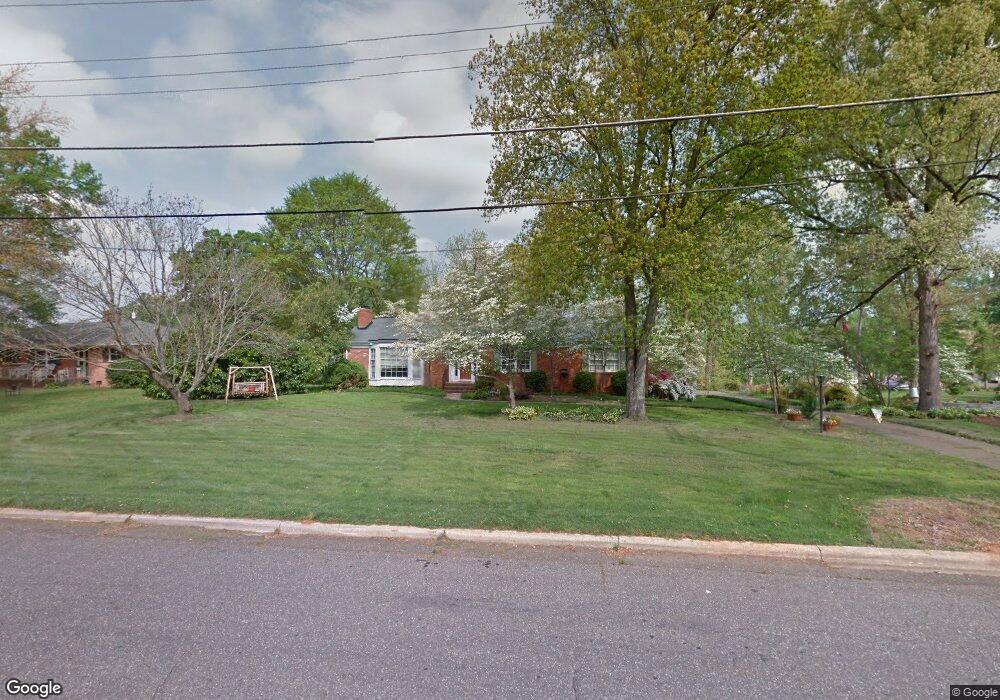
1310 Wesson Rd Shelby, NC 28152
Estimated Value: $277,000 - $324,571
4
Beds
3
Baths
2,441
Sq Ft
$127/Sq Ft
Est. Value
About This Home
This home is located at 1310 Wesson Rd, Shelby, NC 28152 and is currently estimated at $308,893, approximately $126 per square foot. 1310 Wesson Rd is a home located in Cleveland County with nearby schools including Graham Elementary School, James Love Elementary School, and Shelby Middle School.
Ownership History
Date
Name
Owned For
Owner Type
Purchase Details
Closed on
Oct 13, 2016
Sold by
Sherman Daniel Alan and Sherman Sarah
Bought by
King Eric Eugene and King Valerie Sands
Current Estimated Value
Home Financials for this Owner
Home Financials are based on the most recent Mortgage that was taken out on this home.
Original Mortgage
$136,500
Outstanding Balance
$112,086
Interest Rate
4.25%
Mortgage Type
New Conventional
Estimated Equity
$196,807
Purchase Details
Closed on
Aug 30, 2011
Sold by
Amaya Marywinn Shull and Amaya Ricardo
Bought by
Sherman Daniel Alan
Home Financials for this Owner
Home Financials are based on the most recent Mortgage that was taken out on this home.
Original Mortgage
$80,000
Interest Rate
4.4%
Mortgage Type
New Conventional
Create a Home Valuation Report for This Property
The Home Valuation Report is an in-depth analysis detailing your home's value as well as a comparison with similar homes in the area
Home Values in the Area
Average Home Value in this Area
Purchase History
| Date | Buyer | Sale Price | Title Company |
|---|---|---|---|
| King Eric Eugene | $136,500 | None Available | |
| Sherman Daniel Alan | $100,000 | None Available |
Source: Public Records
Mortgage History
| Date | Status | Borrower | Loan Amount |
|---|---|---|---|
| Open | King Eric Eugene | $136,500 | |
| Previous Owner | Sherman Daniel Alan | $80,000 |
Source: Public Records
Tax History Compared to Growth
Tax History
| Year | Tax Paid | Tax Assessment Tax Assessment Total Assessment is a certain percentage of the fair market value that is determined by local assessors to be the total taxable value of land and additions on the property. | Land | Improvement |
|---|---|---|---|---|
| 2025 | $2,684 | $269,775 | $30,449 | $239,326 |
| 2024 | $2,361 | $193,841 | $22,837 | $171,004 |
| 2023 | $2,349 | $193,841 | $22,837 | $171,004 |
| 2022 | $2,349 | $193,841 | $22,837 | $171,004 |
| 2021 | $2,361 | $193,841 | $22,837 | $171,004 |
| 2020 | $1,767 | $140,423 | $21,313 | $119,110 |
| 2019 | $1,767 | $140,423 | $21,313 | $119,110 |
| 2018 | $1,766 | $140,423 | $21,313 | $119,110 |
| 2017 | $1,721 | $140,423 | $21,313 | $119,110 |
| 2016 | $1,208 | $97,727 | $21,313 | $76,414 |
| 2015 | $1,457 | $124,530 | $22,837 | $101,693 |
| 2014 | $1,457 | $124,530 | $22,837 | $101,693 |
Source: Public Records
Map
Nearby Homes
- 1312 Wesson Rd
- 1308 Wesson Rd
- 695 Branton Dr
- 1313 Wesson Rd
- 1311 Wesson Rd
- 1315 Wesson Rd
- 1306 Wesson Rd
- 1400 Wesson Rd
- 1309 Wesson Rd
- 698 Branton Dr
- 1307 Wesson Rd
- 1402 Wesson Rd
- 1401 Wesson Rd
- 1400 Beverly Ave
- 1308 Hammock Ave
- 1306 Hammock Ave
- 1310 Hammock Ave
- 1401 Beverley Ave
- 1401 Beverly Ave
- 1304 Hammock Ave