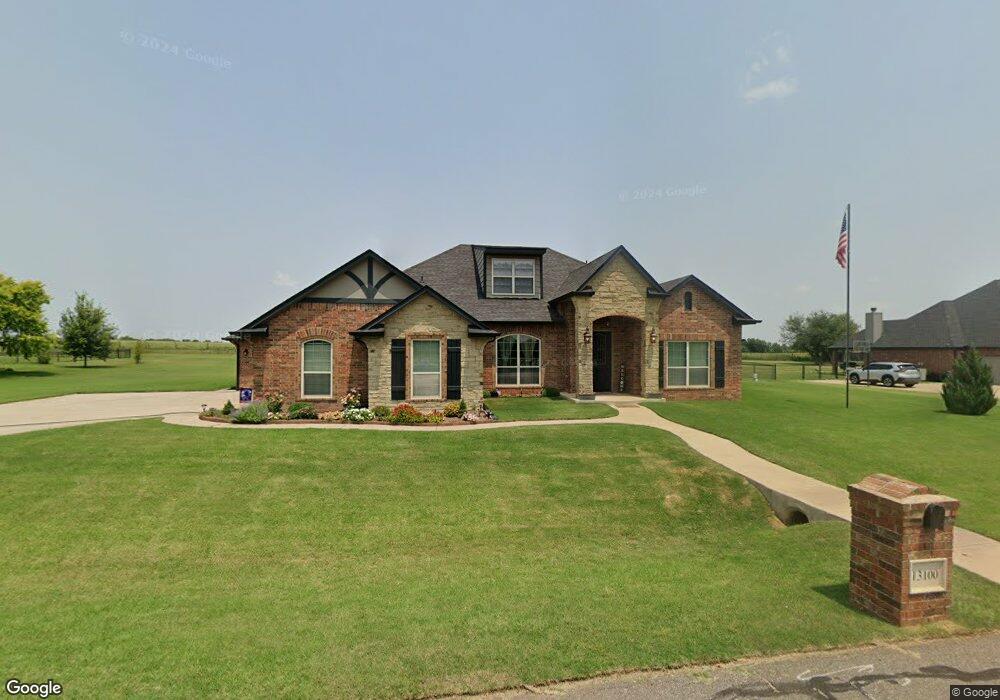
13100 Big Sky Dr Edmond, OK 73025
Navina NeighborhoodEstimated Value: $474,000 - $520,000
3
Beds
3
Baths
2,957
Sq Ft
$167/Sq Ft
Est. Value
About This Home
This home is located at 13100 Big Sky Dr, Edmond, OK 73025 and is currently estimated at $495,116, approximately $167 per square foot. 13100 Big Sky Dr is a home located in Logan County with nearby schools including Rose Union Elementary School, Deer Creek Middle School, and Deer Creek Intermediate School.
Ownership History
Date
Name
Owned For
Owner Type
Purchase Details
Closed on
Apr 23, 2010
Sold by
Intrust Bank Na
Bought by
Ricker Jason L and Ricker Jennifer K
Current Estimated Value
Home Financials for this Owner
Home Financials are based on the most recent Mortgage that was taken out on this home.
Original Mortgage
$245,373
Outstanding Balance
$162,859
Interest Rate
4.93%
Mortgage Type
FHA
Estimated Equity
$332,257
Purchase Details
Closed on
Dec 21, 2007
Sold by
Antler Ridge Development Llc
Bought by
Brass Brick Homes Vii Llc
Home Financials for this Owner
Home Financials are based on the most recent Mortgage that was taken out on this home.
Original Mortgage
$203,055
Interest Rate
6.07%
Mortgage Type
Purchase Money Mortgage
Create a Home Valuation Report for This Property
The Home Valuation Report is an in-depth analysis detailing your home's value as well as a comparison with similar homes in the area
Home Values in the Area
Average Home Value in this Area
Purchase History
| Date | Buyer | Sale Price | Title Company |
|---|---|---|---|
| Ricker Jason L | $250,000 | Stewart Abstract & Title | |
| Brass Brick Homes Vii Llc | $38,000 | Capitol Abstract & Title Com |
Source: Public Records
Mortgage History
| Date | Status | Borrower | Loan Amount |
|---|---|---|---|
| Open | Ricker Jason L | $245,373 | |
| Previous Owner | Brass Brick Homes Vii Llc | $203,055 |
Source: Public Records
Tax History Compared to Growth
Tax History
| Year | Tax Paid | Tax Assessment Tax Assessment Total Assessment is a certain percentage of the fair market value that is determined by local assessors to be the total taxable value of land and additions on the property. | Land | Improvement |
|---|---|---|---|---|
| 2025 | $4,473 | $39,719 | $5,789 | $33,930 |
| 2024 | $4,473 | $37,828 | $5,789 | $32,039 |
| 2023 | $4,473 | $36,026 | $5,789 | $30,237 |
| 2022 | $3,669 | $34,311 | $5,789 | $28,522 |
| 2021 | $3,608 | $34,311 | $5,789 | $28,522 |
| 2020 | $3,569 | $32,724 | $5,789 | $26,935 |
| 2019 | $3,615 | $32,724 | $5,789 | $26,935 |
| 2018 | $3,586 | $32,724 | $5,789 | $26,935 |
| 2017 | $3,583 | $32,461 | $5,599 | $26,862 |
| 2016 | $3,390 | $30,915 | $5,083 | $25,832 |
| 2014 | $2,992 | $28,041 | $3,959 | $24,082 |
| 2013 | -- | $29,806 | $4,293 | $25,513 |
Source: Public Records
Map
Nearby Homes
- 14291 Beaver Creek Rd
- 13581 Hickory Way
- 14474 Old Barn Rd
- 13601 Hickory Way
- 14485 Old Barn Rd
- 14601 Rushing Ln
- 14401 Rushing Ln
- 14580 Rushing Ln
- HOLDEN Plan at Rush Creek
- IRVING Plan at Rush Creek
- 14281 Rushbrook Dr
- 20782 Rush Creek Rd
- 21004 Rush Creek Rd
- 21200 Rush Creek Rd
- 20787 Rush Creek Rd
- 20715 Rush Creek Rd
- 21346 Rush Creek Rd
- 21017 Rush Creek Rd
- 20720 Rush Creek Rd
- 20866 Rush Creek Rd
- 13050 Big Sky Dr
- 14201 Leaning Willow
- 13140 Big Sky Dr
- 14202 Leaning Willow
- 13024 Big Sky Dr
- 14212 Old Barn Rd
- 14240 Leaning Willow
- 14201 Beaver Creek Rd
- 12950 Big Sky Dr
- 13200 Big Sky Dr
- 14251 Leaning Willow
- 14270 Leaning Willow
- 14263 Old Barn Rd
- 14300 Old Barn Rd
- 12905 Big Sky Dr
- 13252 Big Sky Dr
- 14261 Beaver Creek Rd
- 14301 Old Barn Rd
- 14200 Beaver Creek Rd
- 14200 Cottonwood