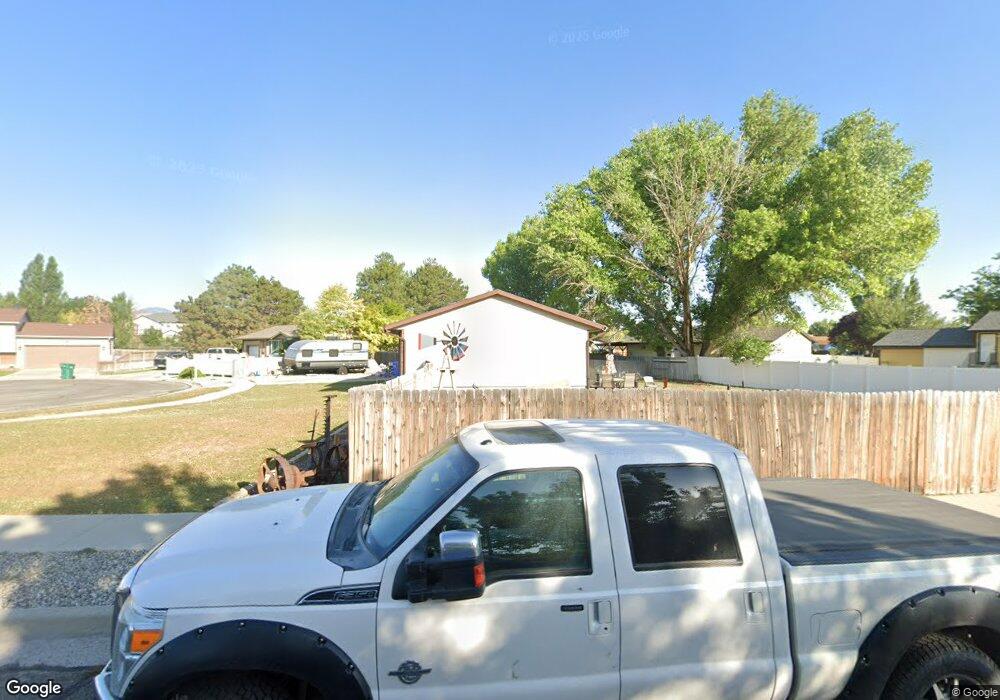
13100 S 2200 W Riverton, UT 84065
Estimated Value: $501,738 - $535,000
4
Beds
2
Baths
2,052
Sq Ft
$252/Sq Ft
Est. Value
About This Home
This home is located at 13100 S 2200 W, Riverton, UT 84065 and is currently estimated at $516,185, approximately $251 per square foot. 13100 S 2200 W is a home located in Salt Lake County with nearby schools including Riverton School, Hidden Valley Middle School, and Riverton High School.
Ownership History
Date
Name
Owned For
Owner Type
Purchase Details
Closed on
Aug 29, 2017
Sold by
Wissler Easton and Johanson Chelsea
Bought by
Wissler Easton J and Wissler Chelsea
Current Estimated Value
Home Financials for this Owner
Home Financials are based on the most recent Mortgage that was taken out on this home.
Original Mortgage
$150,000
Outstanding Balance
$103,689
Interest Rate
3.96%
Mortgage Type
New Conventional
Estimated Equity
$412,496
Purchase Details
Closed on
Jun 20, 2011
Sold by
Jordan Credit Union
Bought by
Wissler Easton and Johanson Chelsea
Home Financials for this Owner
Home Financials are based on the most recent Mortgage that was taken out on this home.
Original Mortgage
$123,780
Interest Rate
4.5%
Mortgage Type
FHA
Purchase Details
Closed on
Mar 8, 2011
Sold by
Jensen Kirk
Bought by
Jordan Credit Union
Purchase Details
Closed on
Oct 30, 2006
Sold by
Roberts Claudia
Bought by
Jensen Kirk
Purchase Details
Closed on
Nov 28, 1994
Sold by
Bangerter Marie and Bangerter Kevin
Bought by
Roberts Claudia
Create a Home Valuation Report for This Property
The Home Valuation Report is an in-depth analysis detailing your home's value as well as a comparison with similar homes in the area
Home Values in the Area
Average Home Value in this Area
Purchase History
| Date | Buyer | Sale Price | Title Company |
|---|---|---|---|
| Wissler Easton J | -- | Title Guarantee S Jordan | |
| Wissler Easton | -- | First American Title | |
| Jordan Credit Union | $160,000 | None Available | |
| Jensen Kirk | -- | Meridian Title | |
| Roberts Claudia | -- | -- |
Source: Public Records
Mortgage History
| Date | Status | Borrower | Loan Amount |
|---|---|---|---|
| Open | Wissler Easton J | $150,000 | |
| Closed | Wissler Easton | $123,780 |
Source: Public Records
Tax History Compared to Growth
Tax History
| Year | Tax Paid | Tax Assessment Tax Assessment Total Assessment is a certain percentage of the fair market value that is determined by local assessors to be the total taxable value of land and additions on the property. | Land | Improvement |
|---|---|---|---|---|
| 2025 | $2,413 | $430,300 | $220,300 | $210,000 |
| 2024 | $2,413 | $417,600 | $209,800 | $207,800 |
| 2023 | $2,459 | $401,300 | $205,600 | $195,700 |
| 2022 | $2,557 | $409,300 | $201,600 | $207,700 |
| 2021 | $2,306 | $320,900 | $122,100 | $198,800 |
| 2020 | $1,983 | $263,500 | $122,100 | $141,400 |
| 2019 | $1,987 | $259,500 | $115,100 | $144,400 |
| 2018 | $1,849 | $237,800 | $115,100 | $122,700 |
| 2017 | $1,766 | $221,400 | $115,100 | $106,300 |
| 2016 | $1,776 | $213,600 | $115,100 | $98,500 |
| 2015 | $1,853 | $216,000 | $117,300 | $98,700 |
| 2014 | $1,785 | $204,000 | $111,800 | $92,200 |
Source: Public Records
Map
Nearby Homes
- 2249 W 13035 S
- 2048 W 12920 S
- 13596 S 2260 W
- 2356 W Montcalm Dr
- 12501 Falls Creek Rd
- 1560 W 12730 S
- 1792 W Dalmeny Way
- 12952 S Croix Cir
- 1788 W Torlundy Dr
- 1821 W Torlundy Dr Unit 32
- 1056 W Kate Springs Ln S Unit 10
- 13283 S Lucky Dog Ln
- 13053 S 1300 W
- 12345 S Redwood Rd
- 13959 S 2200 W
- 3277 W 13120 S
- 12325 S Redwood Rd
- 12317 S Redwood Rd
- 12906 Verona Creek Way
- 1373 W Stewart Falls Dr
- 2231 W 13070 S
- 2231 W 13070 S Unit 144
- 2215 W 13070 S
- 13110 S 2200 W
- 13113 S 2200 W
- 2241 W 13070 S
- 13101 S 2200 W
- 13120 S 2200 W
- 13095 S 2200 W
- 13126 S 2200 W
- 13125 S 2200 W
- 13081 S 2200 W
- 2256 W 13070 S
- 2256 W 13070 S Unit 146
- 13070 S 2200 W
- 13108 S 2110 W
- 2232 W 13070 S
- 13069 S 2200 W
- 13124 S 2110 W
- 13104 S 2110 W