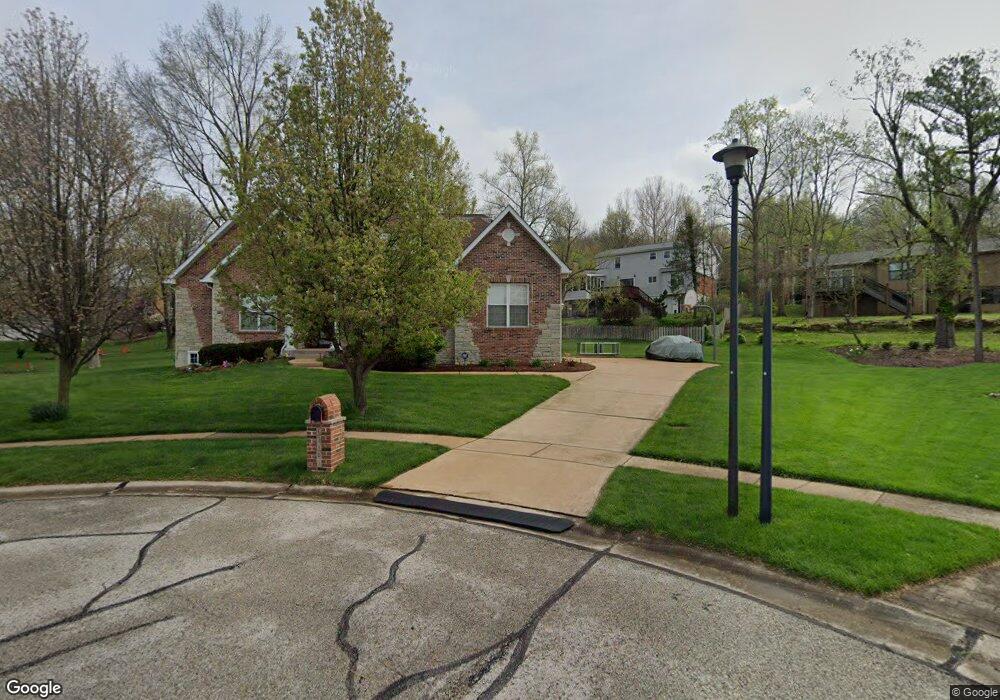
13101 Barrett Circle Ct Ballwin, MO 63021
Estimated Value: $662,000 - $937,000
4
Beds
4
Baths
3,597
Sq Ft
$220/Sq Ft
Est. Value
About This Home
This home is located at 13101 Barrett Circle Ct, Ballwin, MO 63021 and is currently estimated at $791,689, approximately $220 per square foot. 13101 Barrett Circle Ct is a home located in St. Louis County with nearby schools including Barretts Elementary School, Parkway South Middle School, and Parkway South High School.
Ownership History
Date
Name
Owned For
Owner Type
Purchase Details
Closed on
May 19, 2017
Sold by
Brennan Martha L and Brennan James M
Bought by
Brennan James M and Brennan Martha L
Current Estimated Value
Purchase Details
Closed on
Oct 17, 2011
Sold by
Brennan James M and Brennan Martha L
Bought by
Brennan Martha L and Brennan James M
Home Financials for this Owner
Home Financials are based on the most recent Mortgage that was taken out on this home.
Original Mortgage
$102,880
Interest Rate
4.17%
Mortgage Type
New Conventional
Purchase Details
Closed on
Mar 2, 2009
Sold by
Brennan James M and Brennan Martha L
Bought by
Brennan Martha L and Brennan James M
Home Financials for this Owner
Home Financials are based on the most recent Mortgage that was taken out on this home.
Original Mortgage
$107,700
Interest Rate
4.8%
Mortgage Type
New Conventional
Purchase Details
Closed on
Aug 9, 2004
Sold by
M J Anderson Development Llc
Bought by
Brennan James M and Brennan Martha L
Home Financials for this Owner
Home Financials are based on the most recent Mortgage that was taken out on this home.
Original Mortgage
$333,700
Outstanding Balance
$161,288
Interest Rate
5.62%
Mortgage Type
Purchase Money Mortgage
Estimated Equity
$630,401
Create a Home Valuation Report for This Property
The Home Valuation Report is an in-depth analysis detailing your home's value as well as a comparison with similar homes in the area
Home Values in the Area
Average Home Value in this Area
Purchase History
| Date | Buyer | Sale Price | Title Company |
|---|---|---|---|
| Brennan James M | -- | None Available | |
| Brennan Martha L | -- | Investors Title Co Clayton | |
| Brennan James M | -- | Investors Title Co Clayton | |
| Brennan Martha L | -- | Mortgage Information Service | |
| Brennan James M | $631,515 | -- |
Source: Public Records
Mortgage History
| Date | Status | Borrower | Loan Amount |
|---|---|---|---|
| Closed | Brennan James M | $102,880 | |
| Closed | Brennan Martha L | $107,700 | |
| Open | Brennan James M | $333,700 |
Source: Public Records
Tax History
| Year | Tax Paid | Tax Assessment Tax Assessment Total Assessment is a certain percentage of the fair market value that is determined by local assessors to be the total taxable value of land and additions on the property. | Land | Improvement |
|---|---|---|---|---|
| 2025 | $8,042 | $119,710 | $52,540 | $67,170 |
| 2024 | $8,042 | $143,430 | $32,150 | $111,280 |
| 2023 | $7,925 | $143,430 | $32,150 | $111,280 |
| 2022 | $6,444 | $105,910 | $28,140 | $77,770 |
| 2021 | $6,391 | $105,910 | $28,140 | $77,770 |
| 2020 | $6,833 | $114,910 | $38,740 | $76,170 |
| 2019 | $7,147 | $114,910 | $38,740 | $76,170 |
| 2018 | $6,524 | $96,940 | $20,430 | $76,510 |
| 2017 | $6,436 | $96,940 | $20,430 | $76,510 |
| 2016 | $6,608 | $94,630 | $18,530 | $76,100 |
Source: Public Records
Map
Nearby Homes
- 1848 Ridgeview Circle Dr
- 1872 Ridgeview Circle Dr
- 13290 Kenroyal Dr
- 13230 Cozyhill Dr
- 2425 Hidden Meadow Ln Unit I
- 13338 Hiddendale Ln
- 13258 Fairoyal Dr
- 2369 Hidden Meadow Ln
- 9 Enclave Dr
- 11 Enclave Dr
- 759 Carman Woods Dr
- 4 Enclave Dr
- 2 Enclave Dr
- 262 Greenbriar Estates Dr
- 813 Pebblefield Terrace
- 309 Greenbriar Estates Dr
- 1649 Country Hill Ln
- 525 Ballas Park Dr
- 12861 White Rock Ct
- 1117 Arbor Creek Dr Unit 3A
- 2733 Diamond Ridge Ln
- 13100 Barrett Circle Ct
- 2729 Diamond Ridge Ln
- 2737 Diamond Ridge Ln
- 13107 Barrett Circle Ct
- 2724 Barrett Station Rd
- 13106 Barrett Circle Ct
- 2745 Diamond Ridge Ln
- 13164 Huntercreek Ridge Rd
- 13180 Huntercreek Ridge Rd
- 13172 Huntercreek Ridge Rd
- 2716 Barrett Station Rd
- 2751 Diamond Ridge Ln
- 2730 Diamond Ridge Ln
- 2738 Diamond Ridge Ln
- 2748 Barrett Station Rd
- 2755 Diamond Ridge Ln
- 2742 Diamond Ridge Ln
- 13148 Huntercreek Ridge Rd
- 13188 Huntercreek Ridge Rd
Your Personal Tour Guide
Ask me questions while you tour the home.