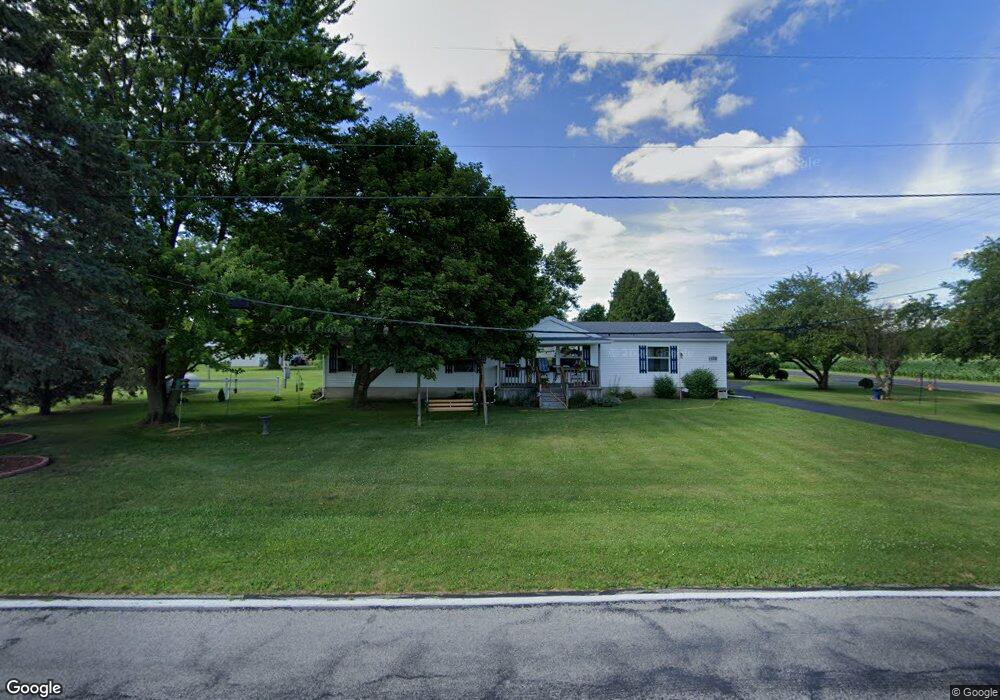
13102 Neowash Rd Grand Rapids, OH 43522
West Lucas County NeighborhoodEstimated Value: $278,242 - $309,000
3
Beds
2
Baths
1,782
Sq Ft
$163/Sq Ft
Est. Value
About This Home
This home is located at 13102 Neowash Rd, Grand Rapids, OH 43522 and is currently estimated at $290,061, approximately $162 per square foot. 13102 Neowash Rd is a home located in Lucas County with nearby schools including Anthony Wayne High School.
Ownership History
Date
Name
Owned For
Owner Type
Purchase Details
Closed on
Jun 3, 2016
Sold by
Inglesby Dennis W
Bought by
Inglesby Dennis W and Inglesby Phyllis D
Current Estimated Value
Home Financials for this Owner
Home Financials are based on the most recent Mortgage that was taken out on this home.
Interest Rate
3.66%
Purchase Details
Closed on
Jun 29, 2006
Sold by
French Kenneth M and French Janine M
Bought by
Inglesby Dennis W and Inglesby Phyllis D
Home Financials for this Owner
Home Financials are based on the most recent Mortgage that was taken out on this home.
Original Mortgage
$80,000
Interest Rate
6.73%
Mortgage Type
Purchase Money Mortgage
Purchase Details
Closed on
Jun 16, 1994
Sold by
French James J
Bought by
French Kenneth M and French Janine M
Home Financials for this Owner
Home Financials are based on the most recent Mortgage that was taken out on this home.
Original Mortgage
$41,600
Interest Rate
5.5%
Mortgage Type
New Conventional
Purchase Details
Closed on
Dec 17, 1990
Sold by
Bishop Terri L
Create a Home Valuation Report for This Property
The Home Valuation Report is an in-depth analysis detailing your home's value as well as a comparison with similar homes in the area
Home Values in the Area
Average Home Value in this Area
Purchase History
| Date | Buyer | Sale Price | Title Company |
|---|---|---|---|
| Inglesby Dennis W | -- | -- | |
| Inglesby Dennis W | $146,000 | None Available | |
| French Kenneth M | $35,000 | -- | |
| -- | $31,400 | -- |
Source: Public Records
Mortgage History
| Date | Status | Borrower | Loan Amount |
|---|---|---|---|
| Closed | Inglesby Dennis W | -- | |
| Previous Owner | Inglesby Dennis W | $80,000 | |
| Previous Owner | French Kenneth M | $41,600 |
Source: Public Records
Tax History Compared to Growth
Tax History
| Year | Tax Paid | Tax Assessment Tax Assessment Total Assessment is a certain percentage of the fair market value that is determined by local assessors to be the total taxable value of land and additions on the property. | Land | Improvement |
|---|---|---|---|---|
| 2024 | $957 | $61,705 | $13,125 | $48,580 |
| 2023 | $2,812 | $59,220 | $7,175 | $52,045 |
| 2022 | $2,862 | $59,220 | $7,175 | $52,045 |
| 2021 | $2,884 | $59,220 | $7,175 | $52,045 |
| 2020 | $3,096 | $47,600 | $5,880 | $41,720 |
| 2019 | $3,011 | $47,600 | $5,880 | $41,720 |
| 2018 | $1,548 | $47,600 | $5,880 | $41,720 |
| 2017 | $2,620 | $40,495 | $6,265 | $34,230 |
| 2016 | $2,534 | $115,700 | $17,900 | $97,800 |
| 2015 | $2,425 | $115,700 | $17,900 | $97,800 |
| 2014 | $2,422 | $39,700 | $6,130 | $33,570 |
| 2013 | $2,422 | $39,700 | $6,130 | $33,570 |
Source: Public Records
Map
Nearby Homes
- 8808 Jeffers Rd
- 0 Jeffers Rd
- 8314 Manore Rd
- 9100 Prov Neap Swan Rd
- 7750 Manore Rd
- 11130 Doran Rd
- 330 County Road 5 2
- U266 County Road 2
- 11255 Stiles Rd
- 12036 Archbold Whitehouse Rd
- 11500 Stiles Rd
- 3101 County Road 1
- 11171 Whitetail Way
- 0 Manore Lot A Rd Unit 6130402
- 0 Manore Lot B Rd Unit 6130403
- 970 County Road 3
- 6952 Red Stag Ct
- 11158 Whitetail Way
- 11154 Whitetail Way
- 6746 Oak Crossing Ln
- 13106 Neowash Rd
- 9140 Jeffers Rd
- 13110 Neowash Rd
- 9120 Jeffers Rd
- 9100 Jeffers Rd
- 9040 Jeffers Rd
- 13230 Neowash Rd
- 8975 Jeffers Rd
- 8970 Jeffers Rd
- 9305 Jeffers Rd
- 13244 Neowash Rd
- 13258 Neowash Rd
- 9300 Jeffers Rd
- 13354 Neowash Rd
- 8921 Jeffers Rd
- 13420 Neowash Rd
- 9333 Manore Rd
- 13450 Neowash Rd
- 12800 Neowash Rd
- 8920 Jeffers Rd