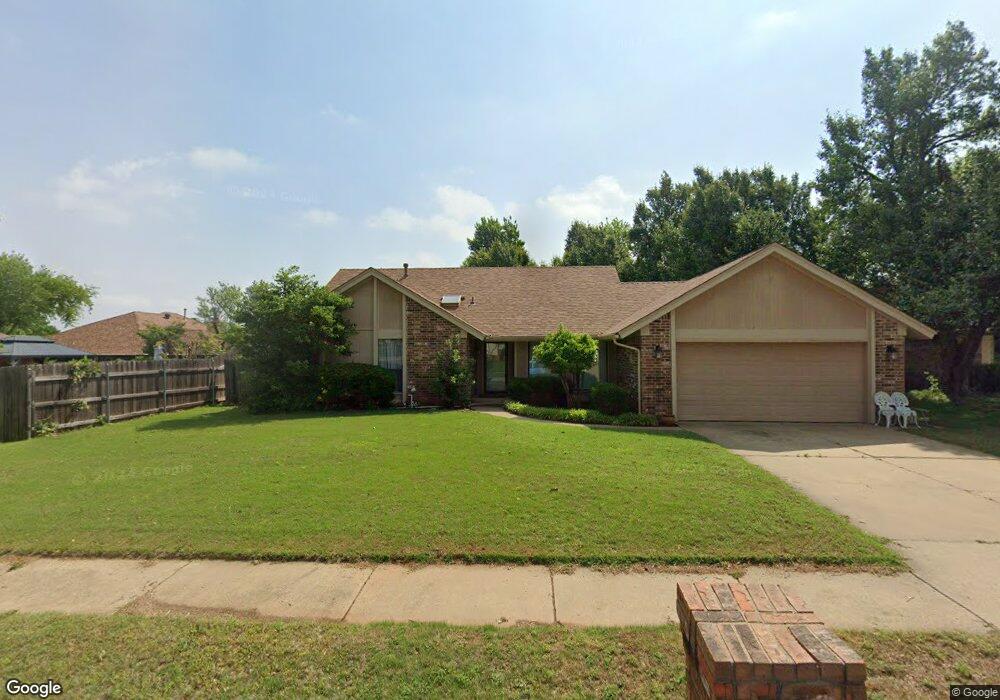
13104 Red Eagle Pass Edmond, OK 73013
Chisholm NeighborhoodEstimated Value: $272,617 - $318,000
3
Beds
2
Baths
1,939
Sq Ft
$154/Sq Ft
Est. Value
About This Home
This home is located at 13104 Red Eagle Pass, Edmond, OK 73013 and is currently estimated at $297,904, approximately $153 per square foot. 13104 Red Eagle Pass is a home located in Oklahoma County with nearby schools including Chisholm Elementary School, Cimarron Middle School, and Memorial High School.
Ownership History
Date
Name
Owned For
Owner Type
Purchase Details
Closed on
Jun 12, 2008
Sold by
Vandergriff Charles M
Bought by
Vandergriff Charles M and Charles M Vandergriff Trust
Current Estimated Value
Purchase Details
Closed on
Sep 7, 2006
Sold by
Rybka Gary Arnold and Wynn Vander Mark
Bought by
Vandergriff Charles
Purchase Details
Closed on
Sep 27, 2002
Sold by
Compton Sarah and Compton Paul
Bought by
Vandergriff Norma Wynn and Norma Wynn Vandergriff Trust
Purchase Details
Closed on
Mar 12, 2001
Sold by
Janway Danny Ray and Janway Deborah Sue
Bought by
Compton Sarah and Compton Paul
Home Financials for this Owner
Home Financials are based on the most recent Mortgage that was taken out on this home.
Original Mortgage
$119,059
Interest Rate
7.1%
Mortgage Type
FHA
Purchase Details
Closed on
Jun 30, 1998
Sold by
Kauffman James W and Kauffman Karen E
Bought by
Janway Danny Ray and Janway Deborah Sue
Create a Home Valuation Report for This Property
The Home Valuation Report is an in-depth analysis detailing your home's value as well as a comparison with similar homes in the area
Home Values in the Area
Average Home Value in this Area
Purchase History
| Date | Buyer | Sale Price | Title Company |
|---|---|---|---|
| Vandergriff Charles M | -- | None Available | |
| Vandergriff Charles | -- | None Available | |
| Vandergriff Norma Wynn | $133,500 | Oklahoma City Abstract & Tit | |
| Compton Sarah | $120,000 | -- | |
| Janway Danny Ray | $110,000 | -- |
Source: Public Records
Mortgage History
| Date | Status | Borrower | Loan Amount |
|---|---|---|---|
| Previous Owner | Compton Sarah | $119,059 |
Source: Public Records
Tax History
| Year | Tax Paid | Tax Assessment Tax Assessment Total Assessment is a certain percentage of the fair market value that is determined by local assessors to be the total taxable value of land and additions on the property. | Land | Improvement |
|---|---|---|---|---|
| 2025 | $2,994 | $26,205 | $4,217 | $21,988 |
| 2024 | $2,829 | $24,957 | $4,182 | $20,775 |
| 2023 | $2,829 | $23,769 | $4,195 | $19,574 |
| 2022 | $2,719 | $22,638 | $4,135 | $18,503 |
| 2021 | $2,563 | $21,560 | $4,329 | $17,231 |
| 2020 | $2,541 | $21,065 | $4,329 | $16,736 |
| 2019 | $2,473 | $20,385 | $4,325 | $16,060 |
| 2018 | $2,370 | $19,415 | $0 | $0 |
| 2017 | $2,389 | $19,689 | $3,896 | $15,793 |
| 2016 | $2,308 | $19,132 | $3,818 | $15,314 |
| 2015 | $2,211 | $18,221 | $3,686 | $14,535 |
| 2014 | $2,100 | $17,353 | $3,359 | $13,994 |
Source: Public Records
Map
Nearby Homes
- 2912 NE 133rd St
- 2821 NE 129th St
- 2713 NE 133rd St
- 4004 Oakdale Farm Cir
- 13808 Oxford Dr
- 13812 Kirkland Ridge
- 13810 Oxford Dr
- 13810 Oxford Dr Unit 13810 & 13808
- 13821 Oxford Dr
- 13412 Auburn Ln
- 13823 Oxford Dr
- 2908 Village Cir
- 21 Oakdale Farm Cir
- 2420 Northwood Ln
- 2412 NE 131st Place
- 4013 NE 137th St
- 13920 Plantation Way
- 2332 Appleway St
- 2328 Butternut Place
- 14301 Canterbury Dr
- 13100 Red Eagle Pass
- 3204 Eagle Pass Ln
- 13105 Silver Eagle Trail
- 13101 Silver Eagle Trail
- 13008 Red Eagle Pass
- 13109 Silver Eagle Trail
- 13105 Red Eagle Pass
- 3112 Eagle Pass Ln
- 13009 Silver Eagle Trail
- 13013 Red Eagle Pass
- 13004 Red Eagle Pass
- 3108 Eagle Pass Ln
- 13005 Silver Eagle Trail
- 3205 Eagle Pass Ln
- 3209 Eagle Pass Ln
- 3201 Eagle Pass Ln
- 13032 Amberwood Place
- 13104 Silver Eagle Trail
- 13009 Red Eagle Pass
- 13108 Silver Eagle Trail
Your Personal Tour Guide
Ask me questions while you tour the home.