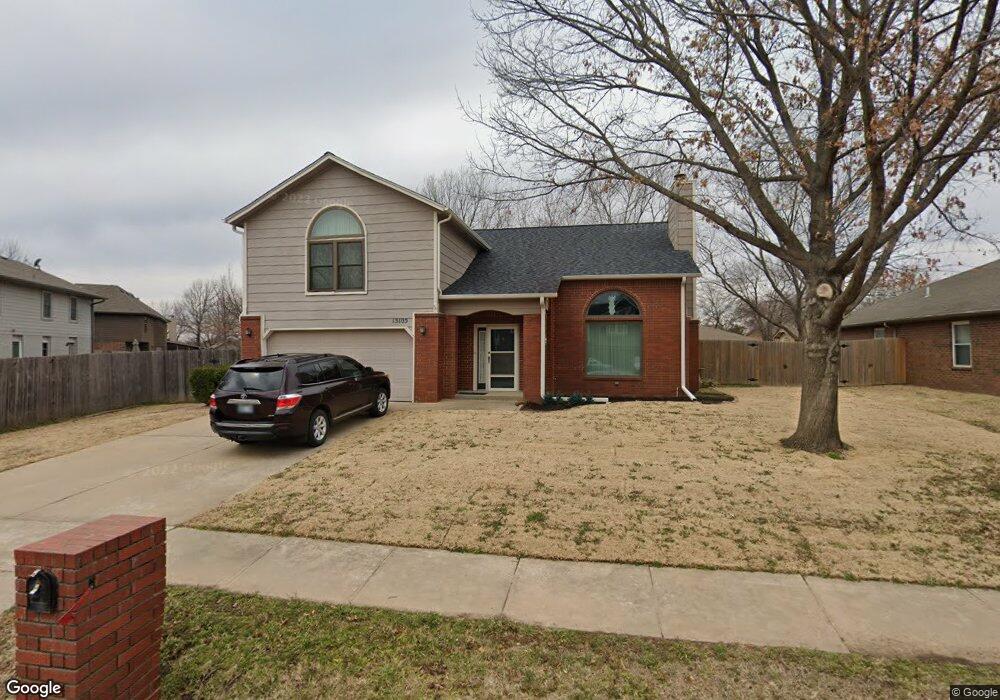
13105 E 80th St N Owasso, OK 74055
Estimated Value: $274,000 - $305,000
3
Beds
3
Baths
2,284
Sq Ft
$126/Sq Ft
Est. Value
About This Home
This home is located at 13105 E 80th St N, Owasso, OK 74055 and is currently estimated at $288,400, approximately $126 per square foot. 13105 E 80th St N is a home located in Tulsa County with nearby schools including Mills Elementary School, Owasso 6th Grade Center, and Owasso 8th Grade Center.
Ownership History
Date
Name
Owned For
Owner Type
Purchase Details
Closed on
Jul 3, 2013
Sold by
Langkamp Theodore G and Langkamp Susan J
Bought by
Langkamp Theodore G and Langkamp Susan J
Current Estimated Value
Purchase Details
Closed on
May 6, 2009
Sold by
Langkamp Theodore G and Langkamp Susan J
Bought by
Langkamp Theodore G and Langkamp Susan J
Purchase Details
Closed on
May 25, 1999
Sold by
Brown Mary Margaret
Bought by
Langkamp Theodore G and Langkamp Susan J
Purchase Details
Closed on
Nov 1, 1993
Purchase Details
Closed on
Sep 1, 1990
Create a Home Valuation Report for This Property
The Home Valuation Report is an in-depth analysis detailing your home's value as well as a comparison with similar homes in the area
Home Values in the Area
Average Home Value in this Area
Purchase History
| Date | Buyer | Sale Price | Title Company |
|---|---|---|---|
| Langkamp Theodore G | -- | None Available | |
| Langkamp Theodore G | -- | None Available | |
| Langkamp Theodore G | $135,000 | Firstitle & Abstract Svcs In | |
| -- | $103,000 | -- | |
| -- | $82,500 | -- |
Source: Public Records
Tax History
| Year | Tax Paid | Tax Assessment Tax Assessment Total Assessment is a certain percentage of the fair market value that is determined by local assessors to be the total taxable value of land and additions on the property. | Land | Improvement |
|---|---|---|---|---|
| 2025 | $2,007 | $17,812 | $1,510 | $16,302 |
| 2024 | $1,821 | $17,264 | $1,459 | $15,805 |
| 2023 | $1,821 | $17,732 | $1,510 | $16,222 |
| 2022 | $1,843 | $16,215 | $1,888 | $14,327 |
| 2021 | $1,768 | $15,713 | $2,152 | $13,561 |
| 2020 | $1,713 | $15,227 | $2,086 | $13,141 |
| 2019 | $1,653 | $14,754 | $2,021 | $12,733 |
| 2018 | $1,551 | $14,295 | $1,958 | $12,337 |
| 2017 | $1,508 | $14,850 | $2,530 | $12,320 |
| 2016 | $1,513 | $14,850 | $2,530 | $12,320 |
| 2015 | $1,525 | $14,850 | $2,530 | $12,320 |
| 2014 | $1,539 | $14,850 | $2,530 | $12,320 |
Source: Public Records
Map
Nearby Homes
- 7916 N 125th East Ave
- 8207 N 128th East Ave
- 9930 N Garnett
- 7710 N 132nd East Ave
- 12410 E 80th Ct N
- 8210 N 126th Ave E
- 7841 N 134th East Ave
- 7705 N 127th East Ave
- 8307 N 126th East Ave
- 13135 E 76th St N
- 13111 E 76th St N
- 7529 N 129th East Ave
- 12207 E 82nd Place N
- 8214 N 122nd East Ave
- 7806 N 121st East Ave
- 11829 E 80th Place N
- 0001 E 86th St N
- 0002 E 86th St N
- 12302 E 87th St N
- 13812 E 87th St N
- 12511 E 80th Ct N
- 12921 E 80th St N
- 12921 E 80tth N
- 12920 E 80th Ct N
- 12912 E 80th Ct N
- 12909 E 80th St N
- 13106 E 80th St N
- 13112 E 80th St N
- 13102 E 80th St N
- 12907 E 80th St N
- 12937 E 80th Ct N
- 13118 E 80th St N
- 12906 E 80th Ct N
- 12914 E 80th St N
- 13124 E 80th St N
- 7910 N 131st East Ave
- 12923 E 80th Ct N
- 12908 E 80th St N
- 12903 E 80th St N
- 12919 E 80th Ct N
Your Personal Tour Guide
Ask me questions while you tour the home.