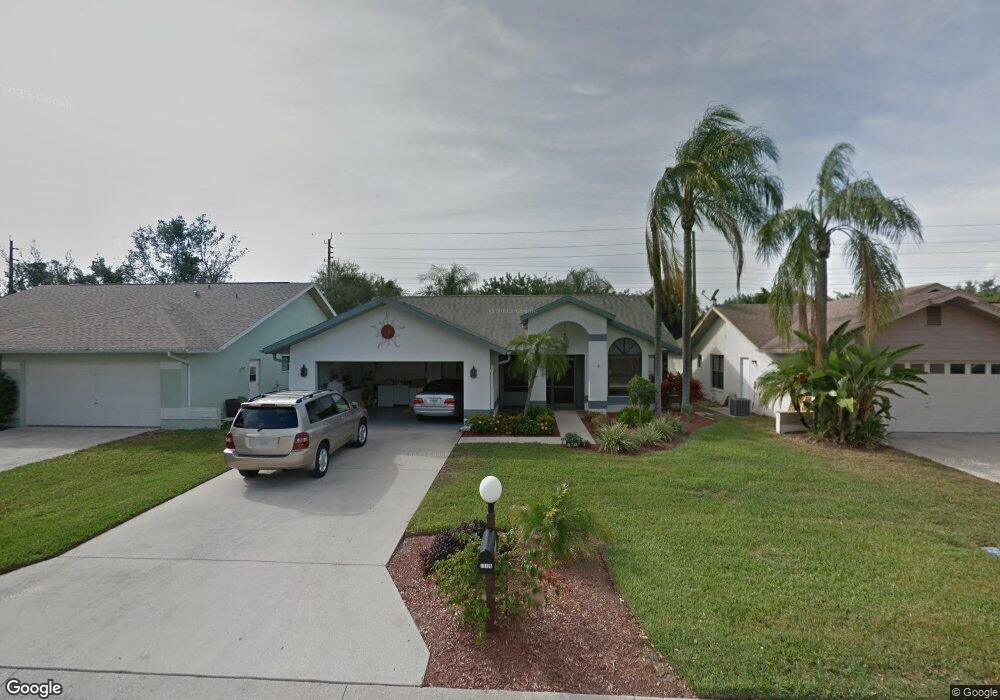
13106 Regent Cir Fort Myers, FL 33966
Mirror Park and Daniels Crossing NeighborhoodEstimated Value: $320,000 - $366,000
2
Beds
2
Baths
1,526
Sq Ft
$220/Sq Ft
Est. Value
About This Home
This home is located at 13106 Regent Cir, Fort Myers, FL 33966 and is currently estimated at $335,879, approximately $220 per square foot. 13106 Regent Cir is a home located in Lee County with nearby schools including Orangewood Elementary School, Allen Park Elementary School, and Edison Park Creative & Expressive Arts School.
Ownership History
Date
Name
Owned For
Owner Type
Purchase Details
Closed on
Sep 9, 2013
Sold by
Wingler David Anthony and Wingler Martha Lynn
Bought by
Maas Ronald L and Hopkins Pamela J
Current Estimated Value
Home Financials for this Owner
Home Financials are based on the most recent Mortgage that was taken out on this home.
Original Mortgage
$147,479
Outstanding Balance
$109,660
Interest Rate
4.31%
Mortgage Type
VA
Estimated Equity
$226,219
Purchase Details
Closed on
Jun 16, 2011
Sold by
Rudinsky Clarissa and Rudinsky Deborah C
Bought by
Wingler David Anthony and Wingler Martha Lynn
Home Financials for this Owner
Home Financials are based on the most recent Mortgage that was taken out on this home.
Original Mortgage
$138,200
Interest Rate
4.71%
Mortgage Type
VA
Purchase Details
Closed on
Apr 29, 2000
Sold by
Rudinsky Edward M and Rudinsky June C
Bought by
Rudinsky Clarissa and Rudinsky Deborah C
Create a Home Valuation Report for This Property
The Home Valuation Report is an in-depth analysis detailing your home's value as well as a comparison with similar homes in the area
Home Values in the Area
Average Home Value in this Area
Purchase History
| Date | Buyer | Sale Price | Title Company |
|---|---|---|---|
| Maas Ronald L | $154,900 | Fidelity National Title Of F | |
| Wingler David Anthony | $135,000 | Attorney | |
| Rudinsky Clarissa | -- | -- |
Source: Public Records
Mortgage History
| Date | Status | Borrower | Loan Amount |
|---|---|---|---|
| Open | Maas Ronald L | $147,479 | |
| Previous Owner | Wingler David Anthony | $138,200 |
Source: Public Records
Tax History Compared to Growth
Tax History
| Year | Tax Paid | Tax Assessment Tax Assessment Total Assessment is a certain percentage of the fair market value that is determined by local assessors to be the total taxable value of land and additions on the property. | Land | Improvement |
|---|---|---|---|---|
| 2025 | $1,947 | $165,643 | -- | -- |
| 2024 | $1,889 | $160,975 | -- | -- |
| 2023 | $1,889 | $156,286 | $0 | $0 |
| 2022 | $1,975 | $151,734 | $0 | $0 |
| 2021 | $1,916 | $185,852 | $45,000 | $140,852 |
| 2020 | $1,922 | $145,281 | $0 | $0 |
| 2019 | $1,876 | $142,015 | $0 | $0 |
| 2018 | $1,868 | $139,367 | $0 | $0 |
| 2017 | $1,861 | $136,500 | $0 | $0 |
| 2016 | $1,837 | $161,726 | $45,000 | $116,726 |
| 2015 | $1,856 | $143,611 | $57,000 | $86,611 |
| 2014 | -- | $131,709 | $30,000 | $101,709 |
| 2013 | -- | $100,297 | $10,800 | $89,497 |
Source: Public Records
Map
Nearby Homes
- 13095 Regent Cir
- 13190 Bella Casa Cir Unit 141
- 13181 Heather Ridge Loop
- 6401 Aragon Way Unit 103
- 6361 Aragon Way Unit 208
- 13160 Bella Casa Cir Unit 1104
- 6341 Aragon Way Unit 106
- 6330 Aragon Way Unit 205
- 13141 Bella Casa Cir Unit 1168
- 6300 Aragon Way Unit 105
- 13138 Radcliffe Dr
- 6265 Mark Ln
- 6851 Pentland Way Unit 13
- 6180 E Pine Pkwy
- 13220 Whitehaven Ln Unit 1402
- 6891 Pentland Way Unit 91
- 13256 Whitehaven Ln Unit 501
- 6441 Emerald Pines Cir
- 13199 Whitehaven Ln Unit 1805
- 13199 Whitehaven Ln Unit 1808
- 13110 Regent Cir
- 13102 Regent Cir
- 13114 Regent Cir
- 13098 Regent Cir
- 13107 Regent Cir
- 13118 Regent Cir
- 13094 Regent Cir
- 13103 Regent Cir
- 13099 Regent Cir
- 13122 Regent Cir
- 13125 Regent Cir
- 13167 Regent Cir
- 13171 Regent Cir
- 13163 Regent Cir
- 13091 Regent Cir
- 13159 Regent Cir
- 13175 Regent Cir
- 6481 Aragon Way
- 6481 Aragon Way Unit 101