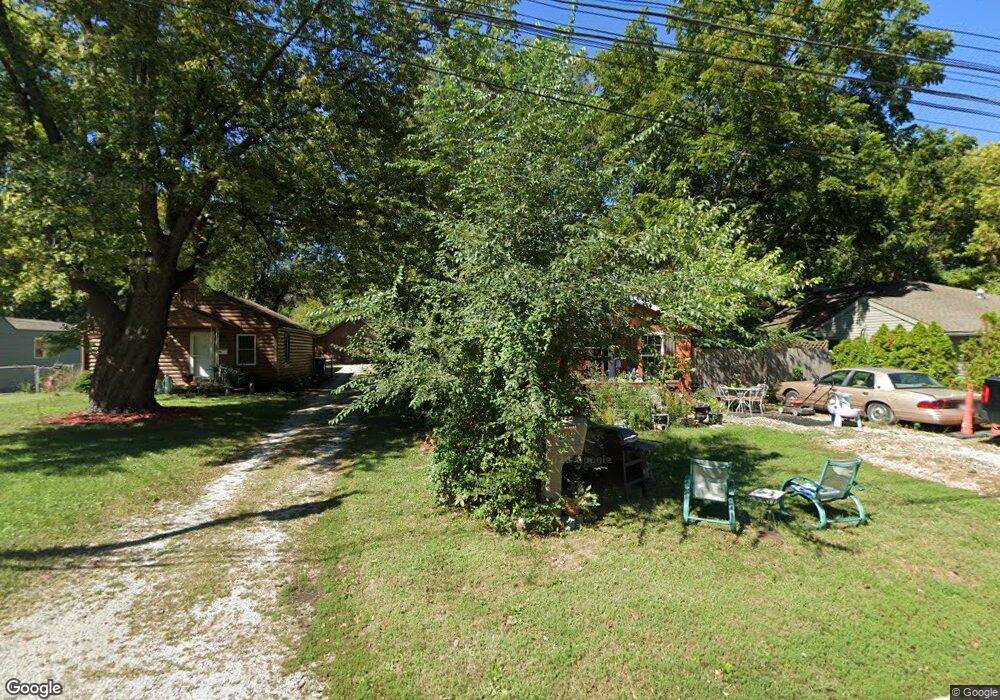
13108 8th St Grandview, MO 64030
Estimated Value: $133,000 - $148,000
2
Beds
1
Bath
980
Sq Ft
$143/Sq Ft
Est. Value
About This Home
This home is located at 13108 8th St, Grandview, MO 64030 and is currently estimated at $140,130, approximately $142 per square foot. 13108 8th St is a home located in Jackson County with nearby schools including Conn-West Elementary School, Grandview Middle, and Grandview High School.
Ownership History
Date
Name
Owned For
Owner Type
Purchase Details
Closed on
Nov 30, 2018
Sold by
Garrett Dale
Bought by
Grijalva Adolfo Medina and Medina Stacy Lemmon
Current Estimated Value
Purchase Details
Closed on
Jul 20, 2012
Sold by
Lundy John and Lundy Wendy
Bought by
Garrett Dale
Purchase Details
Closed on
Jul 28, 2006
Sold by
H & M Restoration Llc
Bought by
Lundy John and Lundy Wendy
Home Financials for this Owner
Home Financials are based on the most recent Mortgage that was taken out on this home.
Original Mortgage
$48,000
Interest Rate
6.66%
Mortgage Type
New Conventional
Purchase Details
Closed on
Aug 23, 2001
Sold by
Dison Harold S and Dison Dawn M
Bought by
H & M Restoration Llc
Purchase Details
Closed on
Apr 17, 1996
Sold by
Teakell Iva
Bought by
Dison Harold S and Dison Dawn M
Home Financials for this Owner
Home Financials are based on the most recent Mortgage that was taken out on this home.
Original Mortgage
$17,843
Interest Rate
7.38%
Mortgage Type
Seller Take Back
Create a Home Valuation Report for This Property
The Home Valuation Report is an in-depth analysis detailing your home's value as well as a comparison with similar homes in the area
Home Values in the Area
Average Home Value in this Area
Purchase History
| Date | Buyer | Sale Price | Title Company |
|---|---|---|---|
| Grijalva Adolfo Medina | -- | None Available | |
| Garrett Dale | -- | None Available | |
| Lundy John | -- | First American Title Company | |
| H & M Restoration Llc | -- | Chicago Title Co | |
| Dison Harold S | -- | Ati Title Company |
Source: Public Records
Mortgage History
| Date | Status | Borrower | Loan Amount |
|---|---|---|---|
| Previous Owner | Lundy John | $48,000 | |
| Previous Owner | Dison Harold S | $17,843 |
Source: Public Records
Tax History Compared to Growth
Tax History
| Year | Tax Paid | Tax Assessment Tax Assessment Total Assessment is a certain percentage of the fair market value that is determined by local assessors to be the total taxable value of land and additions on the property. | Land | Improvement |
|---|---|---|---|---|
| 2025 | $1,118 | $12,814 | $6,812 | $6,002 |
| 2024 | $1,098 | $13,743 | $5,402 | $8,341 |
| 2023 | $1,098 | $13,743 | $4,623 | $9,120 |
| 2022 | $832 | $9,690 | $4,285 | $5,405 |
| 2021 | $831 | $9,690 | $4,285 | $5,405 |
| 2020 | $779 | $9,613 | $4,285 | $5,328 |
| 2019 | $751 | $9,613 | $4,285 | $5,328 |
| 2018 | $764 | $9,105 | $2,042 | $7,063 |
| 2017 | $764 | $9,105 | $2,042 | $7,063 |
| 2016 | $761 | $8,876 | $2,645 | $6,231 |
| 2014 | $756 | $8,703 | $2,594 | $6,109 |
Source: Public Records
Map
Nearby Homes
- 13019 5th St
- 1402 Goode Ave
- 12906 10th St
- 601 Deweese St
- 13301 10th St
- 850 Lakeview Dr
- 4718 E 135th Ct
- 4411 E 135th St
- 13512 Norby Rd
- 14925 S U S 71 Hwy
- 13504 Spruce Ave
- 12610 13th St
- 12604 13th St
- 13608 Spruce Ave
- 13202 Parker Ave
- 12614 Blue Ridge Extension
- 5903 E 127th St
- 12511 Jackson Ave
- 13424 Parker Ave
- 6010 E 127th St
- 13106 8th St
- 13110 8th St
- 13112 8th St
- 13107 8th St
- 13109 8th St
- 13114 8th St
- 713 High Grove Rd
- 13111 8th St
- 711 High Grove Rd
- 13118 8th St
- 707 High Grove Rd
- 707 Highgrove Rd
- 803 High Grove Rd
- 705 High Grove Rd
- 13117 8th St
- 708 High Grove Rd
- 13122 8th St
- 13106 Grandview Rd
- 701 High Grove Rd
- 804 High Grove Rd