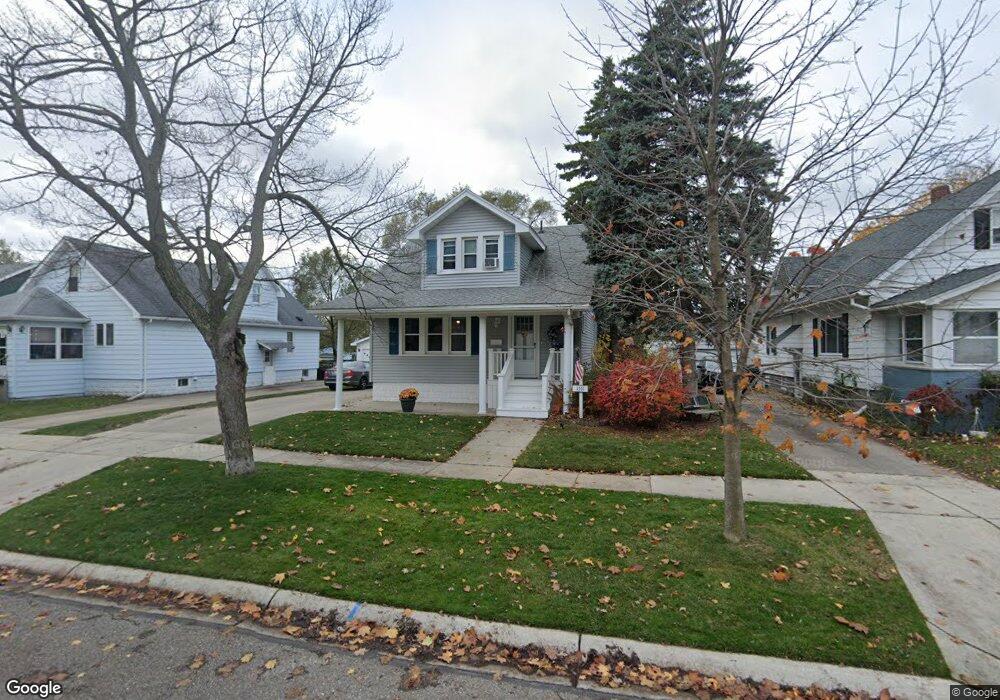
1311 17th St Port Huron, MI 48060
Estimated Value: $142,000 - $149,000
4
Beds
2
Baths
1,284
Sq Ft
$114/Sq Ft
Est. Value
About This Home
This home is located at 1311 17th St, Port Huron, MI 48060 and is currently estimated at $146,005, approximately $113 per square foot. 1311 17th St is a home located in St. Clair County with nearby schools including Michigamme Elementary School, Central Middle School, and Port Huron High School.
Ownership History
Date
Name
Owned For
Owner Type
Purchase Details
Closed on
May 7, 2020
Sold by
Smith Rob K and Smith Diana
Bought by
Smith Rob and Smith Diana
Current Estimated Value
Create a Home Valuation Report for This Property
The Home Valuation Report is an in-depth analysis detailing your home's value as well as a comparison with similar homes in the area
Home Values in the Area
Average Home Value in this Area
Purchase History
| Date | Buyer | Sale Price | Title Company |
|---|---|---|---|
| Smith Rob | -- | Hbi Title Services |
Source: Public Records
Tax History Compared to Growth
Tax History
| Year | Tax Paid | Tax Assessment Tax Assessment Total Assessment is a certain percentage of the fair market value that is determined by local assessors to be the total taxable value of land and additions on the property. | Land | Improvement |
|---|---|---|---|---|
| 2025 | $1,530 | $65,900 | $0 | $0 |
| 2024 | $1,263 | $63,100 | $0 | $0 |
| 2023 | $1,193 | $57,300 | $0 | $0 |
| 2022 | $1,208 | $50,700 | $0 | $0 |
| 2021 | $1,147 | $46,600 | $0 | $0 |
| 2020 | $1,160 | $42,500 | $42,500 | $0 |
| 2019 | $1,139 | $30,600 | $0 | $0 |
| 2018 | $1,114 | $30,600 | $0 | $0 |
| 2017 | $1,143 | $26,600 | $0 | $0 |
| 2016 | $988 | $26,600 | $0 | $0 |
| 2015 | $970 | $24,100 | $24,100 | $0 |
| 2014 | $970 | $23,100 | $23,100 | $0 |
| 2013 | -- | $23,200 | $0 | $0 |
Source: Public Records
Map
Nearby Homes