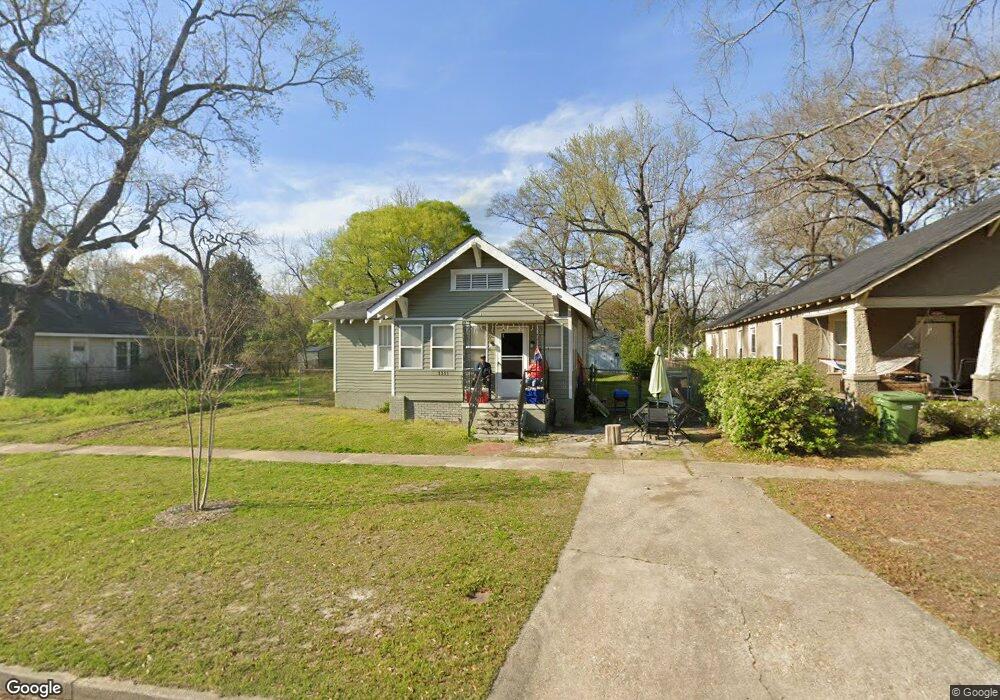
1311 21st St Columbus, GA 31901
East Highlands NeighborhoodEstimated Value: $139,000 - $172,381
2
Beds
3
Baths
1,384
Sq Ft
$114/Sq Ft
Est. Value
About This Home
This home is located at 1311 21st St, Columbus, GA 31901 and is currently estimated at $157,845, approximately $114 per square foot. 1311 21st St is a home located in Muscogee County with nearby schools including Arnold Middle School, Jordan Vocational High School, and Wynnton Elementary School.
Ownership History
Date
Name
Owned For
Owner Type
Purchase Details
Closed on
Nov 20, 2020
Sold by
Cummings Kyle
Bought by
Cummings Corey
Current Estimated Value
Purchase Details
Closed on
Oct 3, 2016
Sold by
Wiggins Robert E
Bought by
Cummings Corey and Cummings Kyle
Home Financials for this Owner
Home Financials are based on the most recent Mortgage that was taken out on this home.
Original Mortgage
$21,000
Interest Rate
3.46%
Purchase Details
Closed on
Aug 15, 2011
Sold by
Flat Rock Rental Holding C
Bought by
Wiggins Robert E
Create a Home Valuation Report for This Property
The Home Valuation Report is an in-depth analysis detailing your home's value as well as a comparison with similar homes in the area
Home Values in the Area
Average Home Value in this Area
Purchase History
| Date | Buyer | Sale Price | Title Company |
|---|---|---|---|
| Cummings Corey | -- | -- | |
| Cummings Corey | $26,000 | -- | |
| Wiggins Robert E | $15,400 | -- |
Source: Public Records
Mortgage History
| Date | Status | Borrower | Loan Amount |
|---|---|---|---|
| Previous Owner | Cummings Corey | $21,000 |
Source: Public Records
Tax History
| Year | Tax Paid | Tax Assessment Tax Assessment Total Assessment is a certain percentage of the fair market value that is determined by local assessors to be the total taxable value of land and additions on the property. | Land | Improvement |
|---|---|---|---|---|
| 2025 | $1,783 | $45,540 | $7,756 | $37,784 |
| 2024 | $1,783 | $45,540 | $7,756 | $37,784 |
| 2023 | $779 | $19,784 | $7,756 | $12,028 |
| 2022 | $808 | $19,784 | $7,756 | $12,028 |
| 2021 | $808 | $29,608 | $7,756 | $21,852 |
| 2020 | $1,209 | $29,608 | $7,756 | $21,852 |
| 2019 | $1,213 | $29,608 | $7,756 | $21,852 |
| 2018 | $1,213 | $29,608 | $7,756 | $21,852 |
| 2017 | $427 | $10,400 | $2,680 | $7,720 |
| 2016 | $650 | $15,762 | $2,600 | $13,162 |
| 2015 | $651 | $15,762 | $2,600 | $13,162 |
| 2014 | $652 | $15,762 | $2,600 | $13,162 |
| 2013 | -- | $15,762 | $2,600 | $13,162 |
Source: Public Records
Map
Nearby Homes
Your Personal Tour Guide
Ask me questions while you tour the home.