NOT LISTED FOR SALE

Estimated Value: $132,705 - $158,000

3 Beds
1 Bath
1,617 Sq Ft
$91/Sq Ft Est. Value

Last Sold March 24, 2015

Last sale price $96,000 $59 Per Sq Ft

Est. 54% increase in value since last sale

Current estimated payment $1,112/month

147 Days on Market

About This Home

As of March 2015

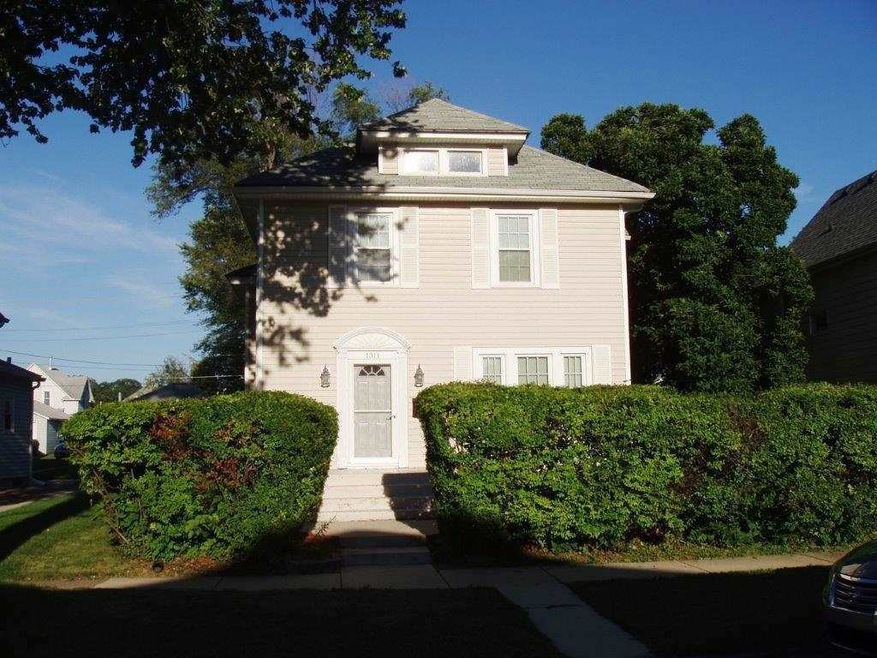
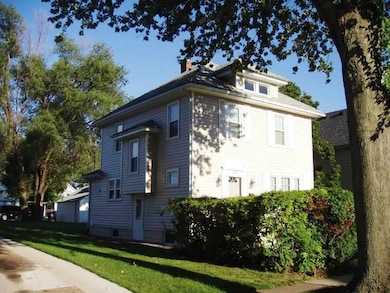
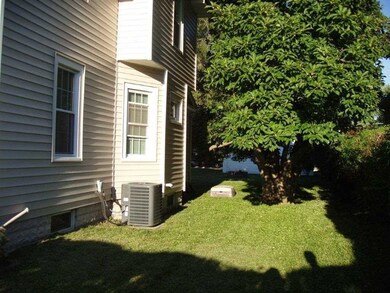
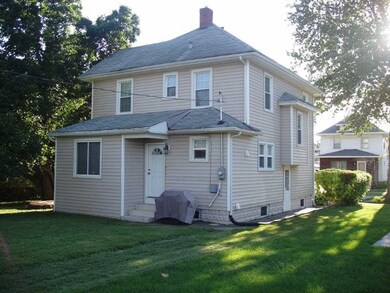
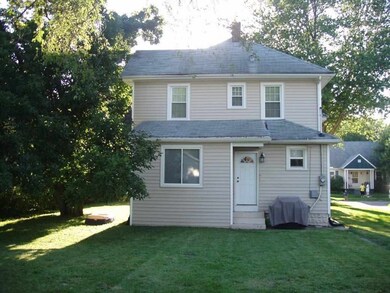
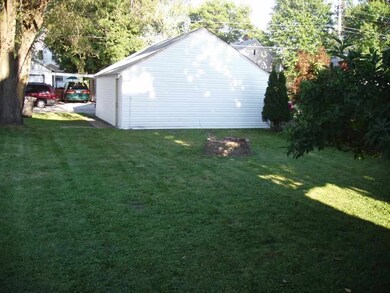
Outstanding 3 BR 2 story with many updates. Updates per seller: Furnace and CA 2007, windows, siding, gutters, sidewalks 2008, Flooring, counter tops, light fixtures, front and rear doors, water heater and interior paint 2009, sump pump 2010, 100 amp electric service 2012, garage roof 2013, garage siding and door 2014. Kitchen is spacious with an abundance of cabinets and the bath is large with storage and nice dressing area.

Last Agent to Sell the Property

Gary Kampmann

Mel Foster Co. Davenport License #S59247000/475.128116 Listed on: 09/16/2014

Mel Foster Co. Davenport

Last Buyer's Agent

Traci Sigwalt

KW 1Advantage License #475.135318

KW 1Advantage

Home Details

Home Type

  • Single Family

Est. Annual Taxes

  • $2,699

Year Built

  • Built in 1925

Lot Details

  • 6,970

Interior Spaces

  • 1 Full Bathroom
  • 2-Story Property
  • Cathedral Ceiling
  • Storage In Attic

Kitchen

  • Oven or Range
  • Range Hood
  • Microwave

Laundry

  • Dryer
  • Washer

Parking

  • Garage
  • Garage Door Opener

Additional Features

  • Porch
  • Cable TV Available

Home Details

Home Type

Single Family

Est. Annual Taxes

$2,699

Year Built

Built in 1925

Lot Details

0

Listing Details

  • Class: Residential
  • Type: Single Family
  • Style: 2 Story
  • Unit Style: 1-Level
  • Legal Description: Lot 3 BLK 4 College Heights ADD.
  • Year Built: 1925
  • Special Features: None
  • Property Sub Type: Detached
  • Stories: 2

Interior Features

  • Appliances: Dryer, Hood/Fan, Microwave Oven, Refrigerator, Range/Oven, Washer
  • Interior Amenities: Attic Storage, Cable Tv Available, Ceilings/Cath/Vault/Tray, Garage Door Opener(s)
  • Total Bathrooms: 1
  • Total Full Baths: 1
  • Bedrooms: 3
  • Master Bedroom: Dimensions: 13x11, On Level: Upper, Flooring: Carpet
  • Basement Foundation: Full
  • Bathroom Master Bedroom: None
  • Bedroom 2: Dimensions: 11x9, On Level: Upper, Flooring: Carpet
  • Bedroom 3: Dimensions: 10x8, On Level: Upper, Flooring: Carpet
  • Formal Dining Room: Dimensions: 14x13, On Level: Main, Flooring: Carpet
  • Informal Dining Room: Dimensions: 11x8, On Level: Main, Flooring: Carpet
  • Kitchen: Dimensions: 19x11, On Level: Main, Flooring: Vinyl
  • Kitchen Dining: Dining Formal, Dining Informal
  • Laundry: On Level: Basement, Flooring: Other
  • Living Room: Dimensions: 23x12, On Level: Main, Flooring: Carpet
  • Total Basement Sq Ft: 759
  • Price Per Sq Ft: 59.37
  • Finished Sq Ft: 1617
  • Total Sq Ft: 1617
  • Finished Main Level Sq Ft: 858
  • Upper Level Finished Sq Ft: 759

Exterior Features

  • Exterior: Vinyl Siding
  • Exterior Amenities: Porch
  • Road Access: Curbs & Gutters, Paved
  • Roofing: Shingles

Garage/Parking

  • Garage Parking: Detached, On Street Parking
  • Number Cars: 2

Utilities

  • Heating Cooling: Gas, Forced Air, Central Air
  • Utilities On: Yes
  • Water Sewer: Public Water, Public Sewer

Lot Info

  • Estimated Lot Size: 50x139
  • Lot Description: Level
  • Subdivision: College Heights
  • Geo Subdivision: IL

Tax Info

  • Annual Taxes: 2699.44
  • Parcel Id Number Tax Id: 1706106003

MLS Schools

  • High School School District: Rock Island

Range of Values:

--
Value Increase
--
Percent Increase
--
Adjusted for Inflation
Collateral Analytics

Collateral Analytics Collateral Analytics AVMs (Automated Valuation Model) employ a number of statistical approaches combined with neighborhood-specific comparable selection guarantees the most up-to-date and precise valuations.

Not Available

Collateral Analytics does not have data for the current month. Please view the chart for historical values.

ICE

ICE Mortgage Technology ICE Mortgage Technology’s AVM (Automated Valuation Model) is a state-of-the-art online residential property valuation tool that provides a quick and accurate estimate of the value of almost any home in the U.S.

Not Available

ICE Mortgage Technology does not have data for the current month. Please view the chart for historical values.

First American

First American First American Data & Analytics’ next-generation AVM combines unrivaled data assets with a blended ensemble of valuation models to produce highly accurate, reliable valuations you can trust.

Not Available

First American does not have data for the current month. Please view the chart for historical values.

Quantarium

Quantarium Quantarium’s valuation service, repeatedly proven the industry’s most accurate and comprehensive, is supercharged with a self-learning and auto-tuning AI engine that continually becomes smarter and more accurate as it processes daily inputs from the industry’s leading RE data lake.

Not Available

Quantarium does not have data for the current month. Please view the chart for historical values.

Average Value
Not Available
List Price
Sold Price
Create a Home Valuation Report for This Property
The Home Valuation Report is an in-depth analysis detailing your home's value as well as a comparison with similar homes in the area

Home Values in the Area

Source: Public Records

Average Home Value in this Area


Source: Public Records

Property History

Date Event Price List to Sale Price per Sq Ft
03/24/2015 03/24/15 Sold $96,000 -10.2% $59 / Sq Ft
02/10/2015 02/10/15 Pending -- -- --
09/16/2014 09/16/14 For Sale $106,900 -- $66 / Sq Ft
Source: RMLS Alliance

Tax History Compared to Growth

Source: Public Records

Tax History

Year Tax Paid Tax Assessment Tax Assessment Total Assessment is a certain percentage of the fair market value that is determined by local assessors to be the total taxable value of land and additions on the property. Land Improvement
2024 $4,007 $39,279 $6,363 $32,916
2023 $4,007 $37,480 $6,072 $31,408
2022 $3,567 $34,383 $5,701 $28,682
2021 $3,532 $32,997 $5,471 $27,526
2020 $3,487 $32,193 $5,338 $26,855
2019 $3,484 $32,193 $5,338 $26,855
2018 $3,351 $31,561 $5,233 $26,328
2017 $3,246 $31,095 $5,156 $25,939
2016 $3,130 $30,485 $5,055 $25,430
2015 $3,001 $28,895 $4,791 $24,104
2014 -- $27,018 $4,737 $22,281
2013 -- $27,018 $4,737 $22,281
Source: Public Records

Agents Affiliated with this Home

  • Section Image
  • Section Image
See All Agents

Map

Source: RMLS Alliance

MLS Number: RMAQC4155108

RMLS Alliance

APN: 17-06-106-003