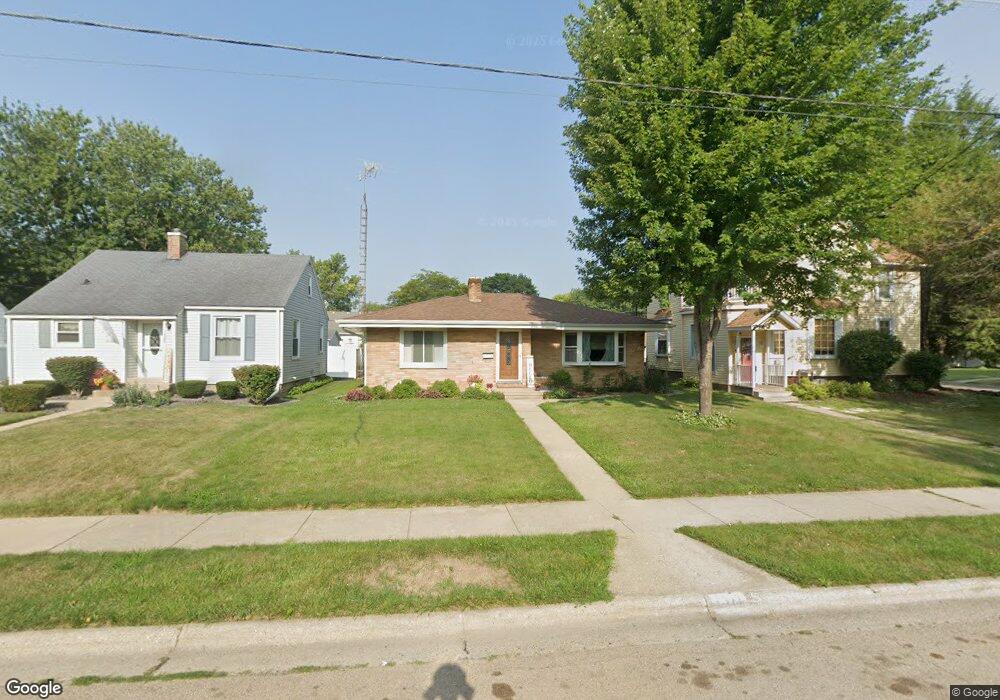
1311 5th Ave Sterling, IL 61081
Estimated Value: $106,000 - $116,833
2
Beds
1
Bath
1,137
Sq Ft
$99/Sq Ft
Est. Value
About This Home
This home is located at 1311 5th Ave, Sterling, IL 61081 and is currently estimated at $112,458, approximately $98 per square foot. 1311 5th Ave is a home located in Whiteside County.
Ownership History
Date
Name
Owned For
Owner Type
Purchase Details
Closed on
Aug 19, 2022
Sold by
Sandoval Donna E
Bought by
Sandoval Donna E and Schofield Deborah
Current Estimated Value
Purchase Details
Closed on
Jun 29, 2022
Sold by
Sandoval Donna E
Bought by
Sandoval Donna E and Schofield Deborah
Purchase Details
Closed on
Jun 27, 2018
Sold by
Sandoval Javier
Bought by
Sandoval Donna
Purchase Details
Closed on
Jan 8, 2009
Sold by
Reynolds Stephanie
Bought by
Sandoval Donna E and Reynolds David A
Home Financials for this Owner
Home Financials are based on the most recent Mortgage that was taken out on this home.
Original Mortgage
$69,910
Interest Rate
5.96%
Mortgage Type
FHA
Create a Home Valuation Report for This Property
The Home Valuation Report is an in-depth analysis detailing your home's value as well as a comparison with similar homes in the area
Home Values in the Area
Average Home Value in this Area
Purchase History
| Date | Buyer | Sale Price | Title Company |
|---|---|---|---|
| Sandoval Donna E | -- | None Listed On Document | |
| Sandoval Donna E | -- | None Listed On Document | |
| Sandoval Donna | -- | -- | |
| Sandoval Donna E | $71,200 | None Available |
Source: Public Records
Mortgage History
| Date | Status | Borrower | Loan Amount |
|---|---|---|---|
| Previous Owner | Sandoval Donna E | $69,910 |
Source: Public Records
Tax History Compared to Growth
Tax History
| Year | Tax Paid | Tax Assessment Tax Assessment Total Assessment is a certain percentage of the fair market value that is determined by local assessors to be the total taxable value of land and additions on the property. | Land | Improvement |
|---|---|---|---|---|
| 2024 | $2,580 | $30,746 | $3,482 | $27,264 |
| 2023 | $2,397 | $28,862 | $3,269 | $25,593 |
| 2022 | $2,309 | $27,614 | $3,128 | $24,486 |
| 2021 | $2,191 | $26,041 | $2,950 | $23,091 |
| 2020 | $2,107 | $25,129 | $2,847 | $22,282 |
| 2019 | $2,082 | $24,672 | $2,795 | $21,877 |
| 2018 | $2,060 | $24,711 | $2,799 | $21,912 |
| 2017 | $2,060 | $24,542 | $2,780 | $21,762 |
| 2016 | $1,986 | $23,751 | $2,690 | $21,061 |
| 2015 | $19 | $24,403 | $2,764 | $21,639 |
| 2014 | $1,898 | $23,862 | $2,703 | $21,159 |
| 2013 | $19 | $24,403 | $2,764 | $21,639 |
Source: Public Records
Map
Nearby Homes