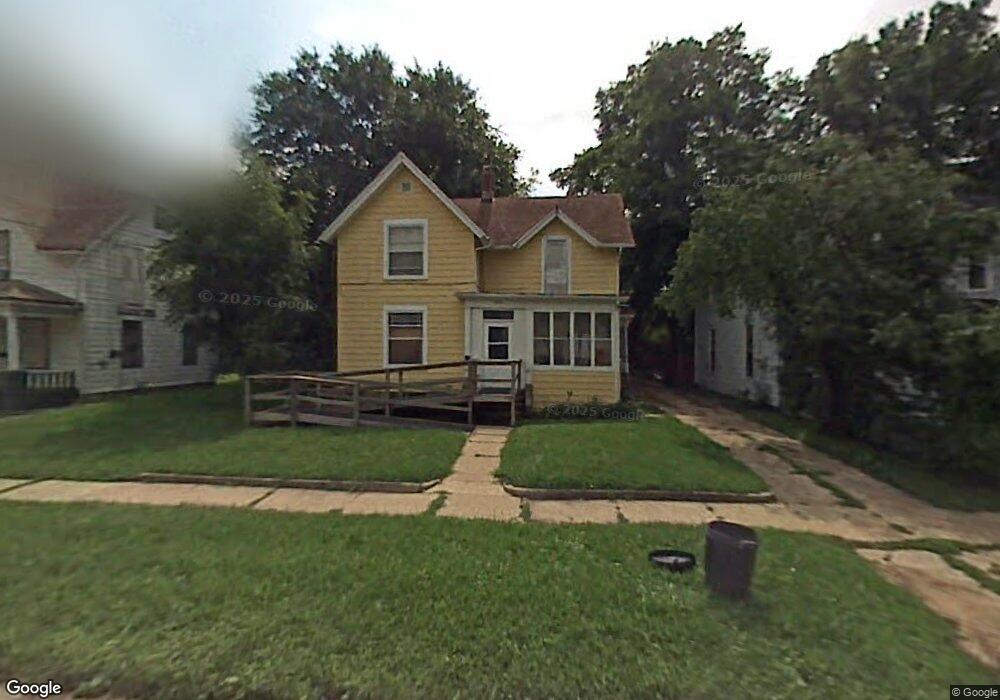
1311 7th Ave Rockford, IL 61104
Midtown District NeighborhoodEstimated Value: $49,000 - $96,000
3
Beds
2
Baths
1,400
Sq Ft
$57/Sq Ft
Est. Value
About This Home
This home is located at 1311 7th Ave, Rockford, IL 61104 and is currently estimated at $79,769, approximately $56 per square foot. 1311 7th Ave is a home located in Winnebago County with nearby schools including Constance Lane Elementary School, Abraham Lincoln Middle School, and Rockford East High School.
Ownership History
Date
Name
Owned For
Owner Type
Purchase Details
Closed on
Dec 5, 2024
Sold by
Petersen Kumarduwati
Bought by
Ace Property Acquisitions Llc
Current Estimated Value
Purchase Details
Closed on
Dec 20, 2022
Sold by
Petersen Kumarduwati
Bought by
Petersen Kumarduwati and Petersen Jeremy Jordan
Purchase Details
Closed on
May 10, 1996
Bought by
Petersen Ku Marduwati
Create a Home Valuation Report for This Property
The Home Valuation Report is an in-depth analysis detailing your home's value as well as a comparison with similar homes in the area
Home Values in the Area
Average Home Value in this Area
Purchase History
| Date | Buyer | Sale Price | Title Company |
|---|---|---|---|
| Ace Property Acquisitions Llc | $45,000 | None Listed On Document | |
| Rot Ethan | $82,500 | None Listed On Document | |
| Ace Property Acquisitions Llc | $45,000 | None Listed On Document | |
| Petersen Kumarduwati | -- | None Listed On Document | |
| Petersen Ku Marduwati | $36,000 | -- |
Source: Public Records
Tax History Compared to Growth
Tax History
| Year | Tax Paid | Tax Assessment Tax Assessment Total Assessment is a certain percentage of the fair market value that is determined by local assessors to be the total taxable value of land and additions on the property. | Land | Improvement |
|---|---|---|---|---|
| 2024 | $1,187 | $12,528 | $1,100 | $11,428 |
| 2023 | $1,147 | $11,047 | $970 | $10,077 |
| 2022 | $1,128 | $9,874 | $867 | $9,007 |
| 2021 | $1,110 | $9,054 | $795 | $8,259 |
| 2020 | $1,101 | $8,560 | $752 | $7,808 |
| 2019 | $1,093 | $8,159 | $717 | $7,442 |
| 2018 | $1,178 | $7,688 | $675 | $7,013 |
| 2017 | $1,092 | $7,358 | $646 | $6,712 |
| 2016 | $1,242 | $8,224 | $635 | $7,589 |
| 2015 | $1,258 | $8,224 | $635 | $7,589 |
| 2014 | $1,714 | $11,060 | $794 | $10,266 |
Source: Public Records
Map
Nearby Homes