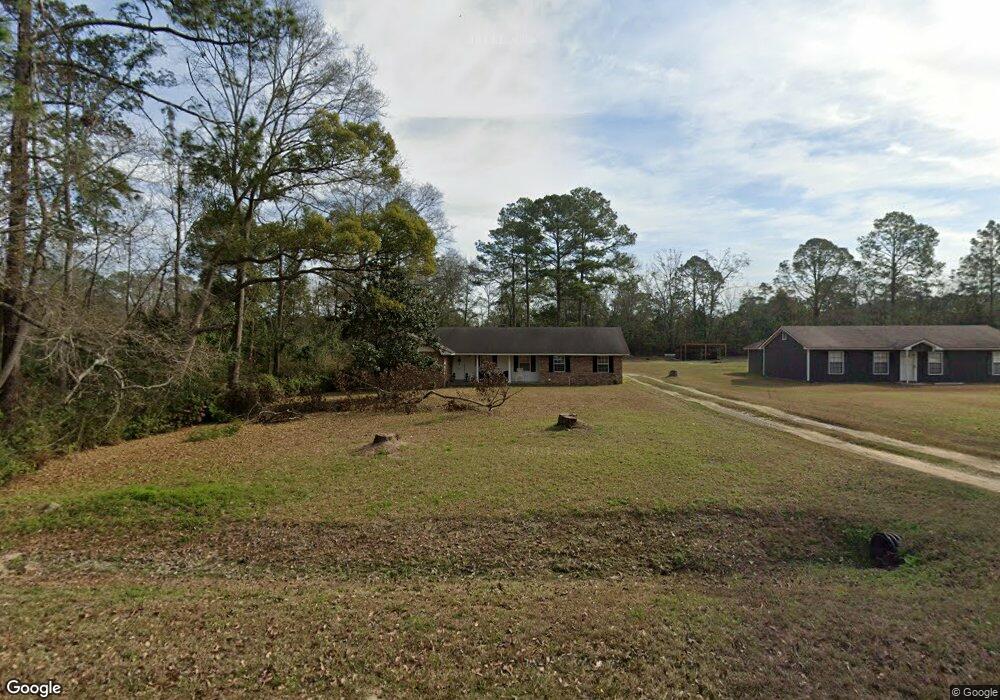
1311 7th St SE Unit A Moultrie, GA 31768
Estimated Value: $150,543 - $238,000
--
Bed
2
Baths
1,651
Sq Ft
$114/Sq Ft
Est. Value
About This Home
This home is located at 1311 7th St SE Unit A, Moultrie, GA 31768 and is currently estimated at $187,886, approximately $113 per square foot. 1311 7th St SE Unit A is a home located in Colquitt County with nearby schools including Cox Elementary School, Willie J. Williams Middle School, and C.A. Gray Junior High School.
Ownership History
Date
Name
Owned For
Owner Type
Purchase Details
Closed on
Dec 4, 2015
Sold by
Carreno Luis E
Bought by
Naranjo Norberto and Soto Susan P
Current Estimated Value
Home Financials for this Owner
Home Financials are based on the most recent Mortgage that was taken out on this home.
Original Mortgage
$88,431
Outstanding Balance
$70,027
Interest Rate
3.91%
Mortgage Type
New Conventional
Estimated Equity
$117,859
Purchase Details
Closed on
Aug 26, 2005
Sold by
Maxwell James D
Bought by
Carreno Luis E and Carreno Eva
Home Financials for this Owner
Home Financials are based on the most recent Mortgage that was taken out on this home.
Original Mortgage
$57,000
Interest Rate
5.71%
Mortgage Type
New Conventional
Purchase Details
Closed on
Dec 17, 1997
Bought by
Maxwell James D
Purchase Details
Closed on
Jul 20, 1978
Bought by
Sewell Carroll J
Create a Home Valuation Report for This Property
The Home Valuation Report is an in-depth analysis detailing your home's value as well as a comparison with similar homes in the area
Home Values in the Area
Average Home Value in this Area
Purchase History
| Date | Buyer | Sale Price | Title Company |
|---|---|---|---|
| Naranjo Norberto | $85,000 | -- | |
| Carreno Luis E | $93,000 | -- | |
| Maxwell James D | $40,000 | -- | |
| Sewell Carroll J | $3,000 | -- |
Source: Public Records
Mortgage History
| Date | Status | Borrower | Loan Amount |
|---|---|---|---|
| Open | Naranjo Norberto | $88,431 | |
| Previous Owner | Carreno Luis E | $57,000 |
Source: Public Records
Tax History Compared to Growth
Tax History
| Year | Tax Paid | Tax Assessment Tax Assessment Total Assessment is a certain percentage of the fair market value that is determined by local assessors to be the total taxable value of land and additions on the property. | Land | Improvement |
|---|---|---|---|---|
| 2024 | $861 | $42,056 | $1,892 | $40,164 |
| 2023 | $845 | $49,415 | $1,892 | $47,523 |
| 2022 | $888 | $39,308 | $1,892 | $37,416 |
| 2021 | $765 | $33,494 | $1,892 | $31,602 |
| 2020 | $778 | $33,494 | $1,892 | $31,602 |
| 2019 | $902 | $34,795 | $1,892 | $32,903 |
| 2018 | $890 | $34,795 | $1,892 | $32,903 |
| 2017 | $893 | $34,795 | $1,892 | $32,903 |
| 2016 | $904 | $34,795 | $1,892 | $32,903 |
| 2015 | $1,042 | $37,451 | $2,304 | $35,147 |
| 2014 | $1,023 | $37,451 | $2,304 | $35,147 |
| 2013 | -- | $37,451 | $2,304 | $35,147 |
Source: Public Records
Map
Nearby Homes
- 1732 4th St SE
- 1701 10th St SE
- M041 5th St SE
- 210 13th Ave SE
- 304 Tallokas Rd
- 1021 11th Ave SE
- 1312 Overlook Dr
- 1117 11th Ave SE
- 29 17th Ave SE
- 1777 S Main St
- 1310 S Main St
- 1904 5th St SE
- 1546 Ivy Ln
- 902 2nd St SE
- 1935 4th St SE
- 1175 4th St SW
- 1712 Villa Dr SW
- 717 5th Ave SE
- 1160 4th St SW
- 521 5th Ave SE Unit 4
- 1397 7th St SE
- 1399 7th St SE
- 1304 10th St SE
- 1300 7th St SE
- 1401 7th St SE
- 1318 10th St SE
- 1402 7th St SE
- 1403 7th St SE
- 517 Maxwell Dr
- 1404 7th St SE
- 516 Maxwell Dr
- 709 Overlook Dr
- 707 Overlook Dr
- 715 Overlook Dr
- 1321 10th St SE
- 1220 10th St SE
- 1408 7th St SE
- 1415 10th St SE
- 511 Overlook Dr
- 1305 5th St SE