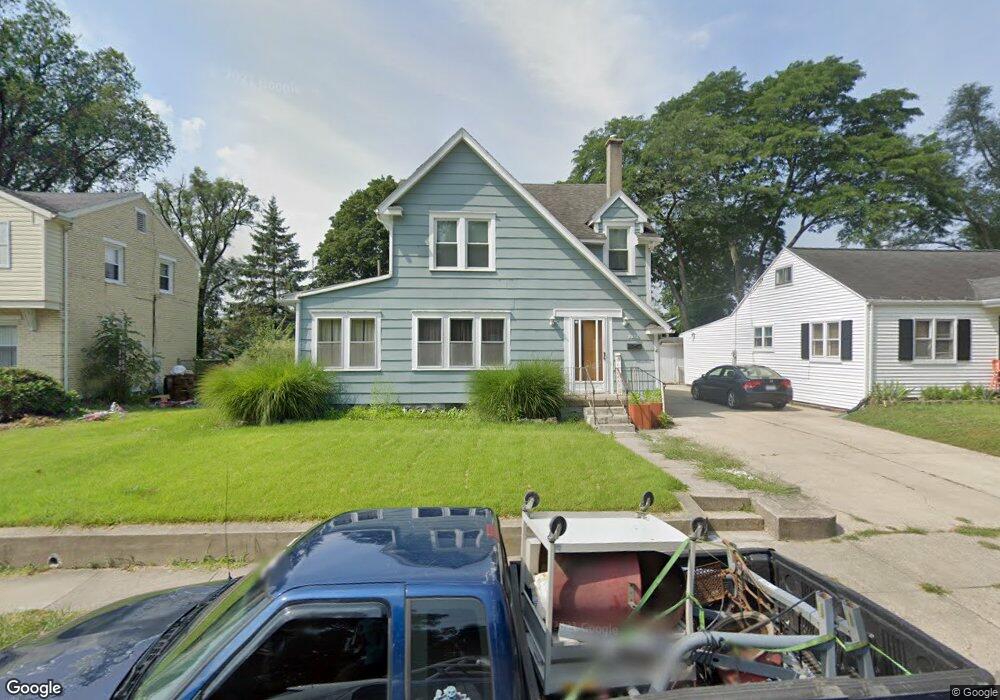
1311 Cedarview Dr E Springfield, OH 45503
Estimated Value: $138,000 - $159,000
3
Beds
2
Baths
1,344
Sq Ft
$114/Sq Ft
Est. Value
About This Home
This home is located at 1311 Cedarview Dr E, Springfield, OH 45503 and is currently estimated at $152,600, approximately $113 per square foot. 1311 Cedarview Dr E is a home located in Clark County with nearby schools including Lagonda Elementary School, Roosevelt Middle School, and Springfield High School.
Ownership History
Date
Name
Owned For
Owner Type
Purchase Details
Closed on
May 31, 2013
Sold by
Catanzaro Francis P and Catanzaro Cynthia A
Bought by
Money Rachea A and Money Rachea
Current Estimated Value
Home Financials for this Owner
Home Financials are based on the most recent Mortgage that was taken out on this home.
Original Mortgage
$63,822
Outstanding Balance
$44,710
Interest Rate
3.38%
Mortgage Type
FHA
Estimated Equity
$107,890
Purchase Details
Closed on
Dec 18, 2012
Sold by
Impac Corp
Bought by
Catanzaro Francis P and Catanzaro Cynthia A
Purchase Details
Closed on
May 23, 2012
Sold by
Wastons Todd A
Bought by
Coynty Of Clark
Purchase Details
Closed on
Feb 6, 1990
Sold by
Rose Orion M and Rose Patricia A
Bought by
Watson Todd A and Watson Peggy
Purchase Details
Closed on
Jun 23, 1988
Create a Home Valuation Report for This Property
The Home Valuation Report is an in-depth analysis detailing your home's value as well as a comparison with similar homes in the area
Home Values in the Area
Average Home Value in this Area
Purchase History
| Date | Buyer | Sale Price | Title Company |
|---|---|---|---|
| Money Rachea A | $65,000 | None Available | |
| Catanzaro Francis P | $22,500 | None Available | |
| Coynty Of Clark | $54,900 | None Available | |
| Watson Todd A | $49,900 | -- | |
| -- | $41,900 | -- |
Source: Public Records
Mortgage History
| Date | Status | Borrower | Loan Amount |
|---|---|---|---|
| Open | Money Rachea A | $63,822 |
Source: Public Records
Tax History
| Year | Tax Paid | Tax Assessment Tax Assessment Total Assessment is a certain percentage of the fair market value that is determined by local assessors to be the total taxable value of land and additions on the property. | Land | Improvement |
|---|---|---|---|---|
| 2025 | $1,553 | $51,390 | $5,330 | $46,060 |
| 2024 | $1,512 | $31,380 | $4,990 | $26,390 |
| 2023 | $1,512 | $31,380 | $4,990 | $26,390 |
| 2022 | $1,549 | $31,380 | $4,990 | $26,390 |
| 2021 | $1,290 | $24,130 | $3,810 | $20,320 |
| 2020 | $1,293 | $24,130 | $3,810 | $20,320 |
| 2019 | $1,296 | $24,130 | $3,810 | $20,320 |
| 2018 | $1,100 | $19,610 | $3,810 | $15,800 |
| 2017 | $1,100 | $17,381 | $3,808 | $13,573 |
| 2016 | $1,101 | $17,381 | $3,808 | $13,573 |
| 2015 | $1,302 | $19,366 | $3,808 | $15,558 |
| 2014 | $1,296 | $19,366 | $3,808 | $15,558 |
| 2013 | $1,282 | $19,366 | $3,808 | $15,558 |
Source: Public Records
Map
Nearby Homes
- 876 E McCreight Ave Unit 2
- 876 E McCreight Ave Unit 878
- 913 Mitchell Blvd Unit 915
- 1015 Rodgers Dr
- 0 Mitchell Blvd
- 836-838 Rodgers Dr
- 364 Ridge Rd
- 726 E Madison Ave
- 1224 Glenmore Dr
- 469-471 E Cecil St
- 308 Ridge Rd
- 1718 Northpoint Rd
- 469 E Cecil St Unit 471
- 329 Roosevelt Dr
- 310 E 3rd St
- 275 Ridge Rd
- 464 E Cassilly St
- 1535 Winding Trail
- 825-827 Elm St
- 412 E Madison Ave
- 1343 Cedarview Dr E
- 1325 Cedarview Dr E Unit 1327
- 1345 Cedarview Dr E Unit 1347
- 1309 Juniper Dr Unit 1311
- 1320 Cedarview Dr W
- 1330 E Cedarview Dr
- 1340 Cedarview Dr E Unit 1342
- 1340 E Cedarview Dr
- 1340-1342 Cedarview Dr E
- 1324 Cedarview Dr W Unit 1326
- 1330-1332 E Cedarview Dr
- 1330 Cedarview Dr E Unit 1332
- 1375 Cedarview Dr E Unit 1377
- 1350 Cedarview Dr E Unit 1352
- 1302 Cedarview Dr W
- 1310 Juniper Dr
- 1334 Cedarview Dr W Unit 1336
- 1334 W Cedarview Dr
- 1334 E Cedarview Dr
- 1275 Cedarview Dr E Unit 1277
Your Personal Tour Guide
Ask me questions while you tour the home.