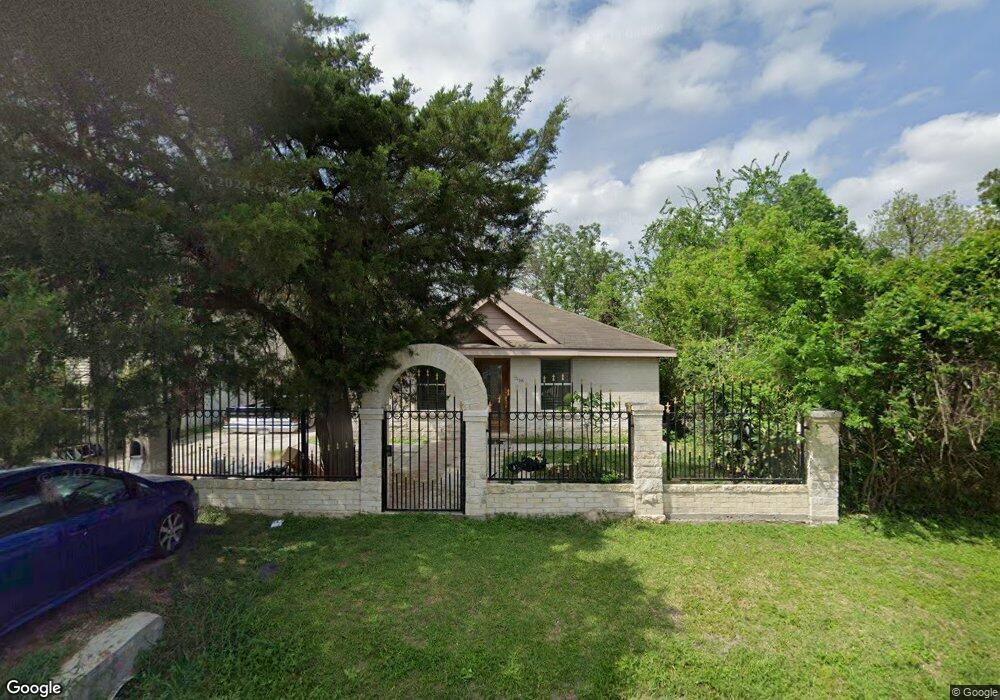
1311 De Boll St Houston, TX 77022
Northside-Northline NeighborhoodEstimated Value: $216,053 - $291,000
3
Beds
1
Bath
1,410
Sq Ft
$181/Sq Ft
Est. Value
About This Home
This home is located at 1311 De Boll St, Houston, TX 77022 and is currently estimated at $255,013, approximately $180 per square foot. 1311 De Boll St is a home located in Harris County with nearby schools including Burbank Elementary School, Burbank Middle School, and Sam Houston Math, Science & Technology Center.
Ownership History
Date
Name
Owned For
Owner Type
Purchase Details
Closed on
Nov 20, 2011
Sold by
Garcia Pascual and Vasquez Veronica
Bought by
Nre Investment Group Llc
Current Estimated Value
Purchase Details
Closed on
Feb 13, 2004
Sold by
Rodriguez Enrique and Rodriguez Tomasita Maria
Bought by
Rodriguez Hector
Home Financials for this Owner
Home Financials are based on the most recent Mortgage that was taken out on this home.
Original Mortgage
$28,500
Interest Rate
5.86%
Mortgage Type
New Conventional
Create a Home Valuation Report for This Property
The Home Valuation Report is an in-depth analysis detailing your home's value as well as a comparison with similar homes in the area
Home Values in the Area
Average Home Value in this Area
Purchase History
| Date | Buyer | Sale Price | Title Company |
|---|---|---|---|
| Nre Investment Group Llc | -- | None Available | |
| Rodriguez Hector | -- | -- |
Source: Public Records
Mortgage History
| Date | Status | Borrower | Loan Amount |
|---|---|---|---|
| Previous Owner | Rodriguez Hector | $28,500 |
Source: Public Records
Tax History Compared to Growth
Tax History
| Year | Tax Paid | Tax Assessment Tax Assessment Total Assessment is a certain percentage of the fair market value that is determined by local assessors to be the total taxable value of land and additions on the property. | Land | Improvement |
|---|---|---|---|---|
| 2025 | $1,146 | $214,501 | $102,600 | $111,901 |
| 2024 | $1,146 | $206,074 | $94,163 | $111,911 |
| 2023 | $1,146 | $233,449 | $57,375 | $176,074 |
| 2022 | $2,124 | $196,457 | $57,375 | $139,082 |
| 2021 | $2,044 | $159,828 | $57,375 | $102,453 |
| 2020 | $1,931 | $146,119 | $57,375 | $88,744 |
| 2019 | $1,834 | $143,023 | $47,250 | $95,773 |
| 2018 | $1,039 | $116,274 | $39,488 | $76,786 |
| 2017 | $1,515 | $116,274 | $39,488 | $76,786 |
| 2016 | $1,377 | $58,990 | $37,125 | $21,865 |
| 2015 | $844 | $49,502 | $27,000 | $22,502 |
| 2014 | $844 | $49,502 | $27,000 | $22,502 |
Source: Public Records
Map
Nearby Homes
- 1207 Firnat St
- 807 Firnat St
- 723 Doverside St
- 702 Pennington St
- 1104 Charnwood St
- 9026 Mcgallion Rd
- 8109 W Hardy Rd
- 8411 Berry Brush Ln
- 9650 E Hardy Rd
- 8402 Berry Green Ln
- 802 Berry Sage Ln
- 8718 Brannon St
- 88 Berry Rd
- 743 Apache St
- 1016 Apache St
- 9630 Burden St
- 9021 Lomax St
- 631 Apache St
- 318 Charlock St
- 9634 Burden St
- 1305 De Boll St
- 1303 De Boll St
- 1223 De Boll St
- 1323 De Boll St
- 1219 De Boll St
- 1327 De Boll St
- 1312 De Boll St
- 1316 De Boll St
- 1320 De Boll St
- 1407 De Boll St
- 1215 De Boll St
- 1306 De Boll St
- 1324 De Boll St
- 1409 De Boll St
- 1213 De Boll St
- 1326 De Boll St
- 1404 De Boll St
- 1211 De Boll St
- 1411 De Boll St
- 1216 De Boll St