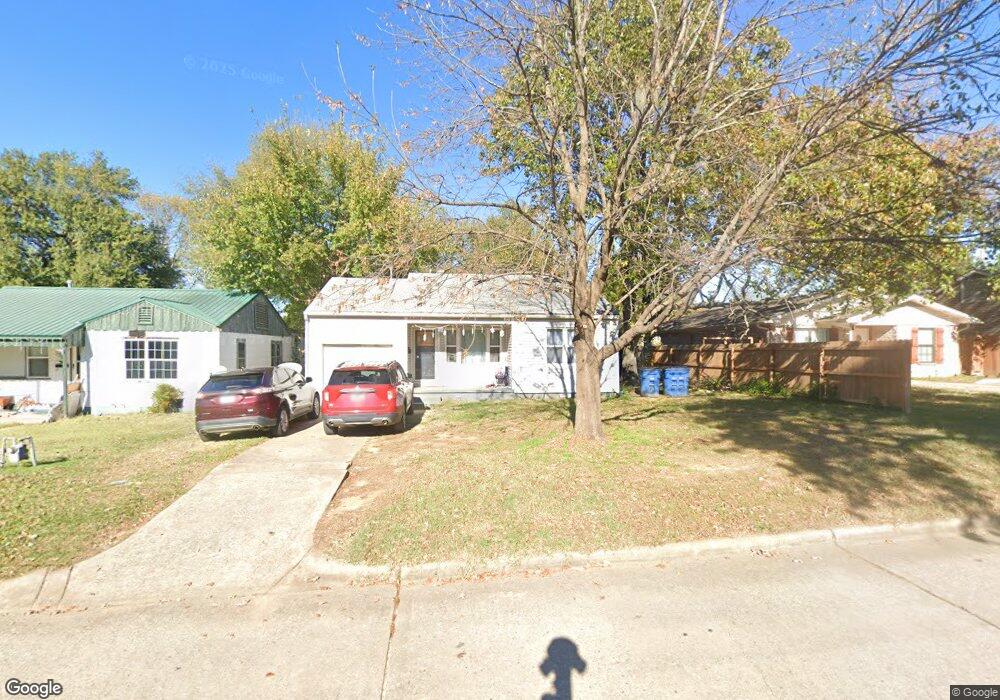
1311 E Seminole Ave McAlester, OK 74501
Estimated Value: $91,000 - $93,000
2
Beds
1
Bath
754
Sq Ft
$122/Sq Ft
Est. Value
About This Home
This home is located at 1311 E Seminole Ave, McAlester, OK 74501 and is currently estimated at $92,133, approximately $122 per square foot. 1311 E Seminole Ave is a home located in Pittsburg County with nearby schools including McAlester High School, Mcalester Christian Academy, and Lakewood Christian School.
Ownership History
Date
Name
Owned For
Owner Type
Purchase Details
Closed on
Oct 28, 2022
Sold by
Elk Inc
Bought by
Nomad Real Estate Holdings Llc
Current Estimated Value
Home Financials for this Owner
Home Financials are based on the most recent Mortgage that was taken out on this home.
Original Mortgage
$56,000
Outstanding Balance
$23,702
Interest Rate
6.7%
Mortgage Type
Credit Line Revolving
Estimated Equity
$68,431
Purchase Details
Closed on
Jul 17, 2006
Sold by
Chapman William F and Chapman Bettie R
Bought by
Quinlan Jolene and Quinlan Donald
Purchase Details
Closed on
Sep 13, 2002
Sold by
Hillyard Karl
Bought by
Chapman William
Purchase Details
Closed on
Jan 22, 2002
Sold by
Lyles Vickie
Bought by
Hillyard Karl
Purchase Details
Closed on
Jul 27, 2001
Sold by
Jackson Jesse
Bought by
Lyles Jim
Purchase Details
Closed on
May 5, 1998
Sold by
Hancock
Bought by
Jackson
Create a Home Valuation Report for This Property
The Home Valuation Report is an in-depth analysis detailing your home's value as well as a comparison with similar homes in the area
Home Values in the Area
Average Home Value in this Area
Purchase History
| Date | Buyer | Sale Price | Title Company |
|---|---|---|---|
| Nomad Real Estate Holdings Llc | $70,000 | Fidelity National Title | |
| Quinlan Jolene | $48,000 | None Available | |
| Chapman William | $49,000 | -- | |
| Hillyard Karl | $45,500 | -- | |
| Lyles Jim | $40,000 | -- | |
| Jackson | $40,000 | -- |
Source: Public Records
Mortgage History
| Date | Status | Borrower | Loan Amount |
|---|---|---|---|
| Open | Nomad Real Estate Holdings Llc | $56,000 |
Source: Public Records
Tax History Compared to Growth
Tax History
| Year | Tax Paid | Tax Assessment Tax Assessment Total Assessment is a certain percentage of the fair market value that is determined by local assessors to be the total taxable value of land and additions on the property. | Land | Improvement |
|---|---|---|---|---|
| 2025 | $739 | $8,402 | $886 | $7,516 |
| 2024 | $739 | $8,085 | $717 | $7,368 |
| 2023 | $709 | $7,701 | $655 | $7,046 |
| 2022 | $371 | $4,236 | $655 | $3,581 |
| 2021 | $498 | $5,727 | $886 | $4,841 |
| 2020 | $474 | $5,412 | $886 | $4,526 |
| 2019 | $415 | $5,155 | $886 | $4,269 |
| 2018 | $416 | $5,155 | $886 | $4,269 |
| 2017 | $420 | $5,155 | $886 | $4,269 |
| 2016 | $418 | $5,155 | $886 | $4,269 |
| 2015 | $401 | $5,390 | $420 | $4,970 |
| 2014 | $401 | $5,390 | $420 | $4,970 |
Source: Public Records
Map
Nearby Homes
- 1204 E Comanche Ave
- 1504 E Comanche Ave
- 617 S 12th St
- 703 S 12th St
- 1507 E Seminole Ave
- 1508 E Comanche Ave
- 1304 E Delaware Ave Unit 1
- 610 S Strong Blvd
- 1401 E South Ave
- 0 S 14th St
- 1504 E Miami Ave
- 415 S 12th St
- 0 E Seminole Ave
- 1004 E Osage Ave
- 0 17th St Unit 2549375
- 0 17th St Unit 2549259
- 800 S 9th St
- 1411 Timber Ln
- 903 E Wyandotte
- 1002 E Creek Ave
- 1313 E Seminole Ave
- 1309 E Seminole Ave
- 1315 E Seminole Ave
- 1358 Compelube Rd
- 1307 E Seminole Ave
- 1308 E Comanche Ave
- 1310 E Comanche Ave
- 1312 E Comanche Ave
- 1310 E Seminole Ave
- 1304 E Comanche Ave
- 1308 E Seminole Ave
- 1303 E Seminole Ave
- 1306 E Seminole Ave
- 1302 E Comanche Ave
- 1301 E Seminole Ave
- 1304 E Seminole Ave
- 1300 E Comanche Ave
- 1300 E Seminole Ave
- 1309 Wichita Ave
- 1311 Wichita Ave